matlab 实验一.docx
《matlab 实验一.docx》由会员分享,可在线阅读,更多相关《matlab 实验一.docx(11页珍藏版)》请在冰豆网上搜索。
matlab实验一
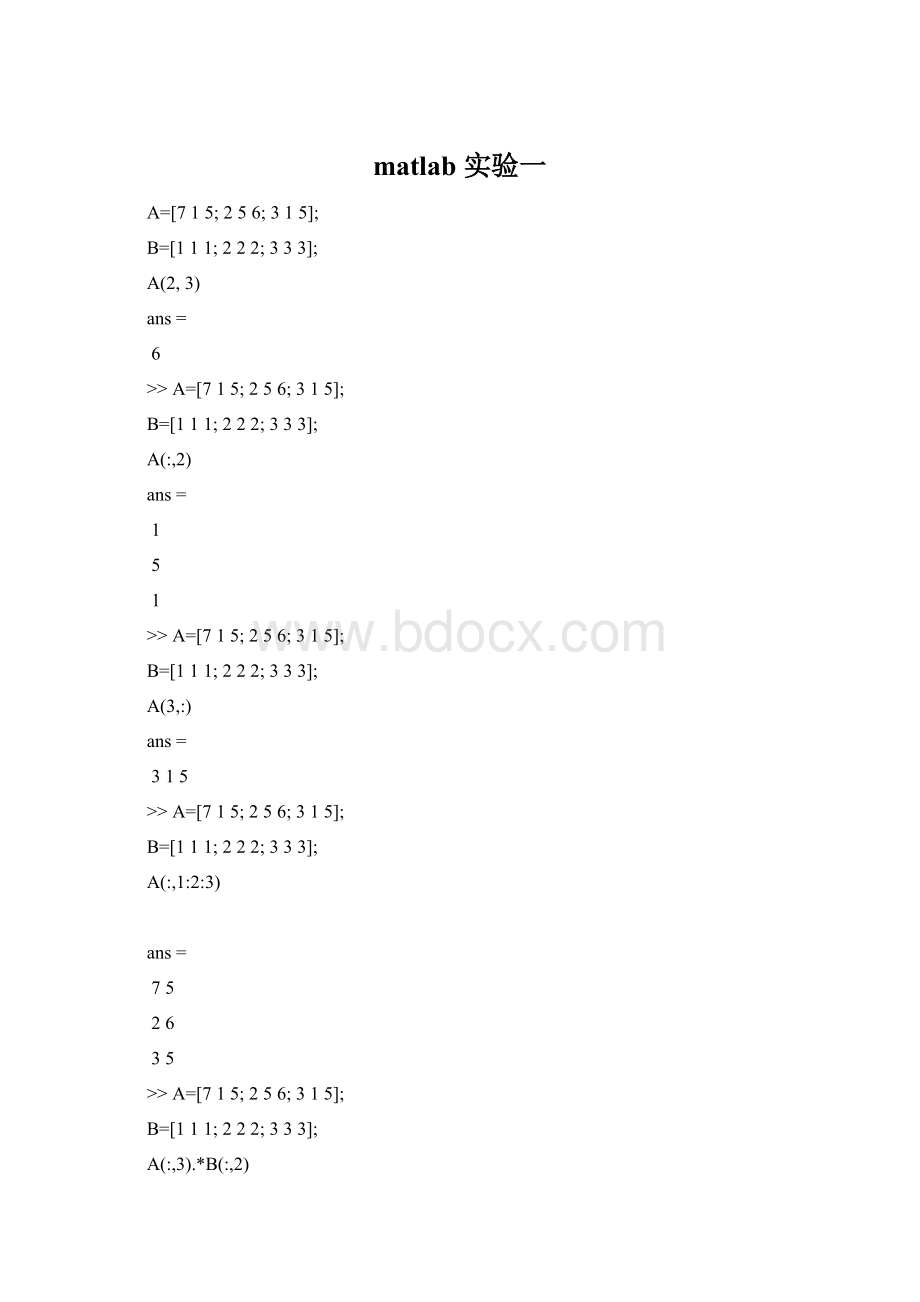
A=[715;256;315];
B=[111;222;333];
A(2,3)
ans=
6
>>A=[715;256;315];
B=[111;222;333];
A(:
2)
ans=
1
5
1
>>A=[715;256;315];
B=[111;222;333];
A(3,:
)
ans=
315
>>A=[715;256;315];
B=[111;222;333];
A(:
1:
2:
3)
ans=
75
26
35
>>A=[715;256;315];
B=[111;222;333];
A(:
3).*B(:
2)
ans=
5
12
15
>>A=[715;256;315];
B=[111;222;333];
A(:
3)*B(2,:
)
ans=
101010
121212
101010
>>A=[715;256;315];
B=[111;222;333];
A*B
ans=
242424
303030
202020
>>A=[715;256;315];
B=[111;222;333];
A.*B
ans=
715
41012
9315
>>A=[715;256;315];
B=[111;222;333];
A^2
ans=
661766
423370
381346
>>A=[715;256;315];
B=[111;222;333];
A.^2
ans=
49125
42536
9125
>>A=[715;256;315];
B=[111;222;333];
B/A
ans=
0.18420.2105-0.2368
0.36840.4211-0.4737
0.55260.6316-0.7105
>>A=[715;256;315];
B=[111;222;333];
B./A
ans=
0.14291.00000.2000
1.00000.40000.3333
1.00003.00000.6000
x=logspace(0,5,6)
x=
Columns1through5
110100100010000
Column6
100000
>>x=linspace(0,10,11)
x=
012345678910
>>x=[0:
1:
10]
x=
012345678910
>>a=[12;34];
b=[22;22];
c=a*b
c=
66
1414
>>a=[12;34];
b=[22;22];
c=a.*b
c=
24
68
>>a=[12;34];
b=[22;22];
c=a/b
Warning:
Matrixisclosetosingularorbadlyscaled.
Resultsmaybeinaccurate.RCOND=5.551115e-017.
c=
1.0e+015*
-2.25182.2518
-2.25182.2518
>>a=[12;34];
b=[22;22];
c=a./b
c=
0.50001.0000
1.50002.0000
>>x=[-4.85-2.3-0.21.34.566.75];
ceil(x)
ans=
-4-20257
>>x=[-4.85-2.3-0.21.34.566.75];
fix(x)
ans=
-4-20146
>>x=[-4.85-2.3-0.21.34.566.75];
floor(x)
ans=
-5-3-1146
>>x=[-4.85-2.3-0.21.34.566.75];
round(x)
ans=
-5-20157
>>a=[5:
1:
15];
b=[12887101211131415];
y=a==b
y=
y=
Columns1through10
0001010011
Column11
1
X=[01;10];
Y=[00;10];
X&Y
ans=
00
10
>>X=[01;10];
Y=[00;10];
X|Y
ans=
01
10
>>X=[01;10];
Y=[00;10];
~X
ans=
10
01
>>x=[01;10];
y=[00;10];
x&y+x>y
ans
ans=
01
10
ans=
01
10
>>a=magic(3);b=243;
savemyvarab;
clear;
loadmyvar;
who
a,b
Yourvariablesare:
ab
a=
816
357
492
b=
243
w=sqrt
(2)*(1+0.34245*10^(-6))
w=
1.4142
>>a=3.5;
b=5;
c=-9.8;
x=(2*pi*a+(b+c)/(pi+a*b*c)-exp
(2))/(tan(b+c)+a)
x=
0.9829
x=1:
0.1:
10;
plot(sin(x))
>>helpplot
PLOTLinearplot.
PLOT(X,Y)plotsvectorYversusvectorX.IfXorYisamatrix,
thenthevectorisplottedversustherowsorcolumnsofthematrix,
whicheverlineup.IfXisascalarandYisavector,length(Y)
disconnectedpointsareplotted.
PLOT(Y)plotsthecolumnsofYversustheirindex.
IfYiscomplex,PLOT(Y)isequivalenttoPLOT(real(Y),imag(Y)).
InallotherusesofPLOT,theimaginarypartisignored.
Variouslinetypes,plotsymbolsandcolorsmaybeobtainedwith
PLOT(X,Y,S)whereSisacharacterstringmadefromoneelement
fromanyorallthefollowing3columns:
bblue.point-solid
ggreenocircle:
dotted
rredxx-mark-.dashdot
ccyan+plus--dashed
mmagenta*star(none)noline
yyellowssquare
kblackddiamond
vtriangle(down)
^triangle(up)
>triangle(right)
ppentagram
hhexagram
Forexample,PLOT(X,Y,'c+:
')plotsacyandottedlinewithaplus
ateachdatapoint;PLOT(X,Y,'bd')plotsbluediamondateachdata
pointbutdoesnotdrawanyline.
PLOT(X1,Y1,S1,X2,Y2,S2,X3,Y3,S3,...)combinestheplotsdefinedby
the(X,Y,S)triples,wheretheX'sandY'sarevectorsormatrices
andtheS'sarestrings.
Forexample,PLOT(X,Y,'y-',X,Y,'go')plotsthedatatwice,witha
solidyellowlineinterpolatinggreencirclesatthedatapoints.
ThePLOTcommand,ifnocolorisspecified,makesautomaticuseof
thecolorsspecifiedbytheaxesColorOrderproperty.Thedefault
ColorOrderislistedinthetableaboveforcolorsystemswherethe
defaultisblueforoneline,andformultiplelines,tocycle
throughthefirstsixcolorsinthetable.Formonochromesystems,
PLOTcyclesovertheaxesLineStyleOrderproperty.
Ifyoudonotspecifyamarkertype,PLOTusesnomarker.
Ifyoudonotspecifyalinestyle,PLOTusesasolidline.
PLOT(AX,...)plotsintotheaxeswithhandleAX.
PLOTreturnsacolumnvectorofhandlestolineseriesobjects,one
handleperplottedline.
TheX,Ypairs,orX,Y,Striples,canbefollowedby
parameter/valuepairstospecifyadditionalproperties
ofthelines.Forexample,PLOT(X,Y,'LineWidth',2,'Color',[.600])
willcreateaplotwithadarkredlinewidthof2points.
Backwardscompatibility
PLOT('v6',...)createslineobjectsinsteadoflineseries
objectsforcompatibilitywithMATLAB6.5andearlier.
Seealsoplottools,semilogx,semilogy,loglog,plotyy,plot3,grid,
title,xlabel,ylabel,axis,axes,hold,legend,subplot,scatter.
Overloadedfunctionsormethods(oneswiththesamenameinotherdirectories)
helptimeseries/plot.m
helpphytree/plot.m
helpchannel/plot.m
helpcfit/plot.m
helpfints/plot.m
helpidmodel/plot.m
helpidfrd/plot.m
helpiddata/plot.m
helpcgrules/plot.m
helpxregtwostage/plot.m
helpxregtransient/plot.m
helpxregmodel/plot.m
helpxregarx/plot.m
helplocalmulti/plot.m
helplocalmod/plot.m
helplocalavfit/plot.m
helpsweepset/plot.m
helpmdevtestplan/plot.m
helpcgdatasetnode/plot.m
helpmpc/plot.m
helprfckt/plot.m
helpfrd/plot.m
helpdspdata/plot.m
helpwdectree/plot.m
helpntree/plot.m
helpdtree/plot.m
helpwvtree/plot.m
helprwvtree/plot.m
helpedwttree/plot.m
ReferencepageinHelpbrowser
docplot
 升级会员
升级会员 