Lecture notes module 1.docx
《Lecture notes module 1.docx》由会员分享,可在线阅读,更多相关《Lecture notes module 1.docx(34页珍藏版)》请在冰豆网上搜索。
Lecturenotesmodule1
PredictingFoodQuality
LecturenotesforModels,errorsanduncertainty(Module1)
TinyvanBoekel,PDQ
Asexplainedintheintroduction,modelsareessentialinpredictingfoodqualityinordertogetagriponit.Thismoduletakesacloserlookatthepropertiesofmathematicalmodelsandtheirstatisticalanalysis,becauseitisnecessarytounderstandtheircharacteristicssothatwecanexploitthemmaximallyforourpurpose.
Structureofmathematicalmodels
Thebasicquestiontoaddressfirstisaboutthenatureofmathematicalmodels.Theyshouldreflectaquantitativerelationshipbetweenvariables.Wecanmakeadistinctionbetweentheindependentvariable(thex-value,e.g.,time,pH,temperature)),theonethatwecansetourselves,andthedependentvariable(they-variable,e.g.,concentration,rateofareaction),theonethatweobserveastheresponseofthesystemthatwearestudyinguponachangeintheindependentvariable.Thesimplestmodelisofthetype:
Eqn1
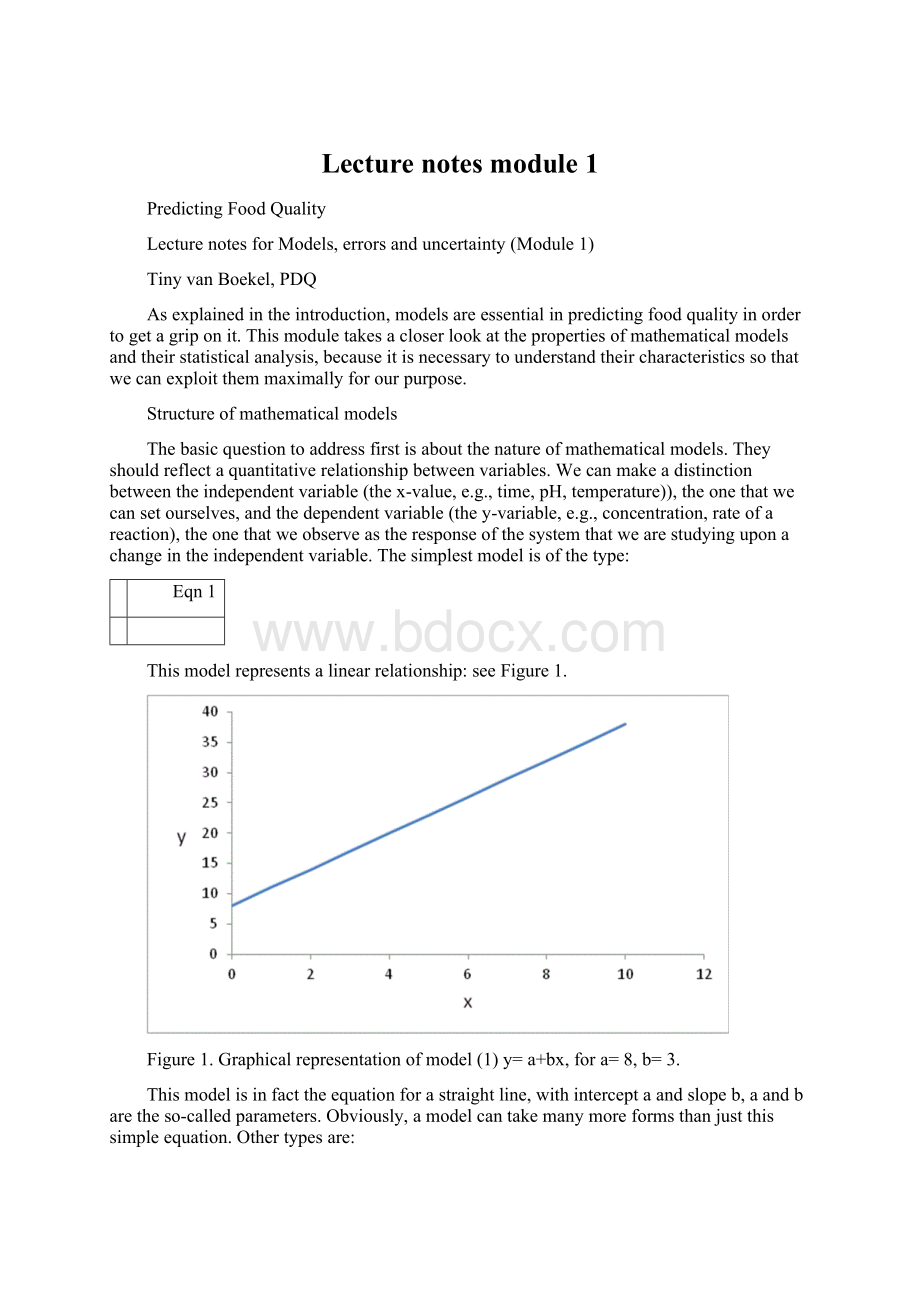
Thismodelrepresentsalinearrelationship:
seeFigure1.
Figure1.Graphicalrepresentationofmodel
(1)y=a+bx,fora=8,b=3.
Thismodelisinfacttheequationforastraightline,withinterceptaandslopeb,aandbaretheso-calledparameters.Obviously,amodelcantakemanymoreformsthanjustthissimpleequation.Othertypesare:
Eqn2
Thismodeldisplaysanexponentialrelationship:
seeFigure2.
Figure2.Graphicalrepresentationofmodel(2:
)y=aexp(bx)fora=2,b=0.3(A)anda=10,b=-0.3(B)
AnothermodelisshowninFigure3,ahyperbola:
Eqn3
Figure3.Graphicalrepresentationofmodel(3)fora=3,b=1
Yetanothermodelisapolynomialoforder3,displayedinFigure4:
Eqn4
Figure4.Graphicalrepresentationofmodel(4),fora=2,b=3,c=4.
So,typically,modelscontaintheindependent(thex-value)andthedependentvariable(they-value)andnexttothattheparameters(a,bandcintheaboveexamples).Itistheparametersthatweareafter,theycontainspecificinformationabouttheunderlyingprocessthatweattempttodescribewithourmodel.
Togeneralize,anequationcanbewrittenas:
Eqn5
inwhichθrepresentsparameters(a,b,cintheaboveexamples),ξrepresentstheindependentvariable(‘thex-value’),andηthedependentorresponsevalue(theyvalue).Equation(5)isthenotationforageneralmodelthatyouoftenfindinstatisticalliterature.
Howcanwefindasuitablemodelforourproblems?
Asstatedbefore,amodelshouldreflectaquantitativerelationbetweenanindependentandaresponsevariable.Weareverymuchdependentonexperimentalmeasurements;thereisnogeneraltheorythatpredictshowrelationsshouldbeinfoods.(Thisisnottosaythattheoryisnotimportant,itdefinitelyisaswealsoshallseeinthiscourse,buttheavailabletheoryisnotsufficienttopredictquantitativerelations.)
Therefore,thefirstthingtodo,always,istosimplyplottheexperimentaldata,andseehowtherelationlookslike.Thiswillgiveanimportantclue,forinstancewhethertherelationislinearornon-linear,whetheritlookslikeahyperbolaoraparabola,etc.Themathematicalmodelsweneedinfood-scienceproblemsareusuallydescribingchangesintimeand/orspace,intheformof:
-Algebraicequations(suchastheonesdisplayedinequations(1–4)
-Differentialequationsoftheform
-Partialdifferentialequationsoftheform
Deterministicandstochasticmodels
Ifyoulookcloselyatsuchequations,youwillnoticethatforfixedvaluesoftheparametersthesameoutputy-valuewillalwaysbefoundforthesameinputxvalue.Thatmakesthemso-calleddeterministicmodels,thereisnouncertaintyinvolved,theoutputvaluesareexactlydeterminedbytheinputvalues.However,asmentionedbefore,weneedtoestimateparametersfromexperiments,andexperimentalvaluesarealwaysuncertaintosomeextent.Itisveryessentialtobeabletoestimatethisexperimentaluncertainty;fortunatelywecandothatfromrepeatedexperiments.
Errorsanderrors
So,themodelsthatwearegoingtousearebaseduponexperimentalobservations.Experimentalobservationsalwayscontainunexplicableandunavoidableerrorandthereforealsothemodelsbasedupontheseexperimentswillbeuncertain,andsincewewanttousemodelstopredict,alsoourpredictionswillcontainacertainerror!
Thisistheveryreasonwhyweinsistsomuchondiscussingerrors:
theyarealwaysthereandweneedtocharacterizethemquantitatively.
Atthisstageitisimportanttospendattentiontotwoconceptsinrelationtomeasurements:
accuracyandprecision.Accuracyisabouthowclosemeasurementsaretotherealvalue.Thisisaphilosophicallyinterestingstatementbecausewedonotknowtherealvalue,weare,afterall,tryingtoestimateit!
Nevertheless,thereisareal,truevaluethatwewanttoapproximateascloseaspossible;ifthereisaconstant,systematicdeviationbetweentheactualmeasurementandthe(unknown)truevaluethisiscalledasystematicerror.Accuracycanonlybeobtainedbycarefullycalibratinginstruments,solutions,weightingmeasurements,etc.,usingmaterialswithaknowncomposition.Thisisthefullresponsibilityoftheresearcherwhodoesthemeasurement.Statisticscannotcorrectforsystematicerrors!
Theotherconceptisofprecision:
howclosearethemeasuredvaluestogether,orhowstronglyaretheydispersed?
Thesearerandomerrorsthatoccurbychanceanduncontrolled.Youcanhaveanaccuratebutimprecisemeasurement,butalsoanimprecisebutaccuratemeasurement.Figure5givesanimpressionofthepossibilities.Thestatisticalmethodsthatwediscussinthiscourseareaboutprecision;weassumethataccurateresultshavebeenobtainedorreportedinliterature,i.e.,withoutsystematicerror.Wealsoassumethatrandomerrorsaremeasuredandreported;theyareeasilyidentifiedbydoingrepetitions.Unfortunately,manyliteraturesourcesdonotreporttheseerrorsveryclearly,whichmaybeconsideredacapitalsininscience!
Figure5.Aschematicrepresentationofaccuracyandprecision
Wecanmakeafurtherdivisioninthenatureofrandomerrors,namelyhomoscedasticandheteroscedasticerrors:
seeFigure6.
Figure6.Schematicrepresentationofhomoscedastic(A)andheteroscedasticerrors(B,C).
Homoscedasticerrorsareerrorsthatdonotdifferwiththex-values,orinotherwords,theerrorsareapproximatelyconstantandindependentoftheindependentvariablex;heteroscedasticerrorsdodependonthex-value.InFigure7Bthecaseisshownthattheerrorsinyincreasewithincreasingx.Itcould,inprinciple,bealsotheotherwayaround,asshowninFigure7C.Itisveryinstructivejusttoplotresultssothatitisimmediatelyobviouswhethertheerrorsarehomoscedasticornot.Theimportanceofknowingthisbecomesclearwhenwediscussregressiontechniquesinamoment.
Howtoestimateerrors?
Animportantconsequenceofexperimentaluncertaintyisthaterrorsarecarriedovertotheparameters.So,weareinneedofmodelsthatareabletoexpressthisuncertainty.Thatbringsusintotheareaofstochasticmodels.Equation(5)needstobeextendedasfollows:
Eqn6
Thetermεrepresentsthe“error”term(itisnotanerrorinthesensethatsomethingiswrong,itrepresentstheuncertaintywearefacedwith).Howcanweputanumbertothiserrorterm?
Quitesimplyfromexperiments(afterhavingexcludedsystematicerrors,seeabove):
repeatinganexperiment(notjustthemeasurementbutthewholetreatment!
)inexactlythesamewayshowstheuncontrollablevariation,andbydoingthatafewtimesthemeanandstandarddeviationcanbecalculated(preferablymorethantwotimesbecauseastandarddeviationbasedontwomeasurementsisquiteunreliable).Experimentaluncertaintytypicallyreducesbydoingmorerepetitions(seebelow).Nexttoexperimentaluncertaintythereisalsobiologicalvariation:
foodsarenaturalmaterialsandtheircompositionvaries:
twoapplesthatcomefromthesametreewillvarynevertheless.Thisisunavoidableandwecannotreduceit,butwecancharacterizeitviastatistics!
Thisleadstowell-knownparametersasthemean,standarddeviation,standarderror,confidenceintervals.Let’sshowsomeexamples.SupposeafoodchemistinLabAdeterminedthecalciumcontentofthesamemilkinfiverepetitions(n=5),whileanotherfoodchemistdidthesamethinginLabBonthesamesampleofmilkbutnowwithtenrepetitions(n=10):
Sampleno
Calciumcontent(mg/100gmilk)
LabA
Calciumcontent(mg/100gmilk)
LabB
1
117.7
121.4
2
119.5
114.6
3
121.3
116.1
4
117.6
120.9
5
110.2
109.3
6
116.1
7
117.3
8
119.8
9
116.6
10
123.5
Table1.Determinationsontheestimationofthecalciumcontentinmilkintwodifferentlabs
Notethatthisexperimentalsetupgivesinformationabouttheimprecisionofmeasuring.Itdoesnotgiveinformationaboutbiologicalvariationbecausethesamebatchofmilkwasanalysed.Forinformationaboutbiologicalvariabilityofcalciuminmilk,onewouldhavetoanalysesamplesfromdifferentbatches;thevariabilityobservedinsuchacasewouldbethesumofthecontributionofthebiologicalvariability+theexperimentaluncertainty.
Forthepresentexample,thesamplemeanis:
Eqn7
Thisresultsin117.3mg/100gmilkforLabAand117.6mg/100gmilkforLabB.Notethatthemeansarenotexactlythesame,butquiteclose.
Thesamplevariancevis:
Eqn8
Thisresultsinv=17.8forLabAand16.6forLabB.
Thesamplevarianceisactuallythesumofsquaresdividedbythedegreesoffreedom;onedegreeoffreedomislostbecausethemeanisesti
 升级会员
升级会员 