vb窗口使用excel.docx
《vb窗口使用excel.docx》由会员分享,可在线阅读,更多相关《vb窗口使用excel.docx(47页珍藏版)》请在冰豆网上搜索。
vb窗口使用excel
OWC使用方法
OWC==>OfficeWebComponents
是微软Office的轻量级开发工具,随Office安装时一起安装
Office2003版本对应OWC11,里面有5个控件对象
图表工作区对象
数据源控件对象
记录集控件对象
数据透视表列表对象
电子表格对象
很久以前用过的,最近有人问就翻出来看看
其实很简单,只是可能没有到注意文档罢了
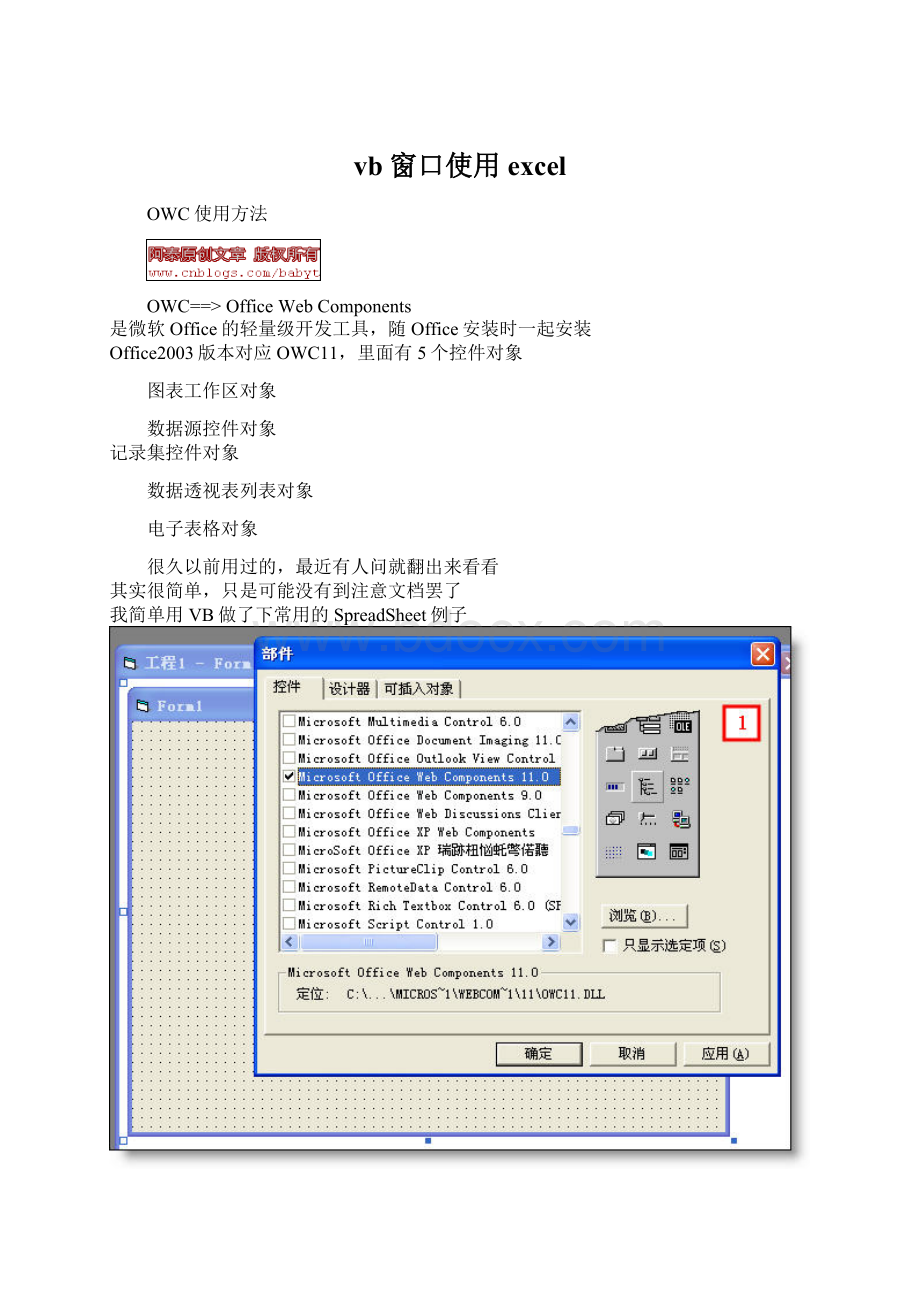
我简单用VB做了下常用的SpreadSheet例子
Form上加一个Spreadsheet控件
代码,很简单,没什么好说的
Private Sub Form_Load()
'单元格
'可以使用循环的方式填充单元格
Spreadsheet1.Cells(1, 1) = "第1个格"
Spreadsheet1.Cells(1, 5) = "第5个格"
'区域
'合并
Spreadsheet1.Range("A3:
D3").Merge
Spreadsheet1.Range("A3:
D3").Value = "合并效果"
'格式设置
Spreadsheet1.Range("A3:
D3").Font.Name = "黑体"
Spreadsheet1.Range("A3:
D3").Font.Size = 15
Spreadsheet1.Range("A3:
D3").Borders(xlEdgeTop).Color = vbRed
Spreadsheet1.Range("A3:
D3").Borders(xlEdgeBottom).Color = vbRed
Spreadsheet1.Range("A3:
D3").Borders(xlEdgeLeft).Color = vbRed
Spreadsheet1.Range("A3:
D3").Borders(xlEdgeRight).Color = vbRed
'' '不提示直接保存为本地文件
'' Spreadsheet1.Export "c:
\xxx.xls", ssExportActionNone
'' '直接在Excel中打开
'' Spreadsheet1.Export "c:
\xxx.xls", ssExportActionOpenInExcel
End Sub
运行出来就是这个样子
因为整个编程中使用了VBA语法,所以还是很容易理解的
如果你的机器上安装了Office2000/xp/2003
那么你的机器上已经有使用文档及开发文档了,很详尽,参照一下,应该没啥问题。
我的机器装的是2003,在如下位置上有相关文档
C:
\Program Files\Common Files\Microsoft Shared\Web Components\10\2052
C:
\Program Files\Common Files\Microsoft Shared\Web Components\11\2052
前面的文档都是使用帮助
OWCVBA11.CHM是开发文档
ChartSpace对象:
图形容器对象,也是顶层对象。
如果要使用OWC绘制图形,至少要创建一个ChartSpace对象。
所谓容器,就是说ChartSpace对象中可以包含多个图形对象,最多16个。
ChChart对象、ChCharts集合、ChCharts.Add()方法:
ChChart是图形对象。
一个柱状图、饼状图、散点图等都是一个图形对象,多个图形对象构成ChCharts集合。
ChartSpace对象就包含一个ChCharts集合,这些ChChart之间互相叠加,比如簇状条形图就是多个单柱状图的叠加,圆环套圆环图就是两个单圆环图的叠加。
通过ChCharts.Add()方法增加一个图形。
ChSeries对象、ChSeriesCollection集合、ChSeriesCollection.Add()方法:
帮助中说:
一个ChSeries对象表示图中的一个系列。
实际上,你可以这样理解,当图形容器中包含多个图形时,一个ChSeries对象就表示其中的一个图形,可以通过ChSeriesCollection集合,可以使用数组的方式访问各个ChSeries,比如ChSeriesCollection[0]表示第一个图形。
使用ChSeriesCollection.Add()方法在当前容器中新增一个图形。
Point属性和Points集合:
一个Point代表图形中的一个部分,比如柱状图的一条柱,饼状图的一个扇区等。
ChChart对象提供Points集合,可以使用数组的形式访问各个Point,比如Points[0]表示第1个部分。
Interior属性:
代表一个形状的内部空间。
比如,ChartSpace对象的Interior属性代表图形容器内、图形外的空间,一个扇区Interior属性表示该扇区的内部空间。
该属性在设置图形各个部分的颜色时起到重要作用。
窃以为,以上对象和属性的理解、使用非常关键,顺着它们找下去,标题、图例、数据标签、字体等重要的特性都能顺利找到。
OWC简介及其属性(转)
2008-10-2117:
06
Figure3OfficeWebComponents(version10)
组件
描述
PivotTable
使用户连接到支持OLEDBProviderforOLAPServices8.0或更高版的OLAP数据源上(也可连接到Excel电子数据表单和SQLServer、Access关系数据库)。
PivotTable控件允许用户对数据进行透视、分组、筛选和排序等操作。
Spreadsheet
提供电子数据表单用户接口,包括重算引擎和扩展函数库。
Chart
图形化显示来自某个绑定数据源、PivotTable或Spreadsheet控件的数据。
当Chart组件被绑定到PivotTable控件且用户重新透视数据时能自动刷新。
DataSource
管理与后台数据库服务器的通讯。
PivotTable和Spreadsheet组件实际上能单独连接到数据源,,不一定非得要DataSource组件。
这是因为其XML数据可以直接包含OLEDB连接串。
Figure4PivotTableandChart-relatedObjects
成员
描述
PivotTable
使用户连接到支持OLEDBProviderforOLAPServices8.0或更高版的OLAP数据源上(也可连接到Excel电子数据表单和SQLServer、Access关系数据库)。
PivotTable控件允许用户对数据进行透视、分组、筛选和排序等操作。
PivotView
表示PivotTable的一个特定视图.用于对PivotTable视图中的行、列、标尺、格式化进行设置。
PivotDataAxis
包含与数据轴相关的方法和属性
PivotResultColumnAxis
包含与列轴相关的方法和属性
PivotResultRowAxis
包含与行轴相关的方法和属性
PivotFieldSet
多维数据集中定义的字段集
PivotField
多维数据集中定义的字段
ChartSpace
使用户连接到支持OLEDBProviderforOLAPServices8.0或更高版的任何OLAP数据源上,(也可连接到Excel电子数据表单和SQLServer、Access关系数据库)。
ChartSpace允许用户图形化显示数据并且将控件绑定到一个已存在的PivotTable或Spreadsheet。
ChCharts
ChChart对象集合
ChChart
ChartSpace中的单个图表,一个ChartSpace可容纳多达64个图表。
Figure5PivotTableComponent'sProgrammaticInterface
成员
类型
描述
ActiveView
属性
表示一个活动的PivotTable布局。
该属性返回一个PivotView对象。
ColumnAxis
属性
表示列轴中的字段。
返回一个PivotAxis对象。
ConnectionString
属性
设置连接到AnalysisServices服务器的连接字符串,ConnectionString属性中的DataSource参数决定了OWC组件将要使用的连接协议。
DataAxis
属性
表示数据轴的规模。
返回一个PivotAxis对象。
DataMember
属性
设置控件将要从AnalysisServices请求的数据源名称。
它与多维数据集同名。
IncludedMembers
属性
定义了PivotField内的数据成员。
该属性接受的参数为单一成员或成员数组。
IsIncluded
属性
设置所包含的字段并激活PivotFieldSet。
RowAxis
属性
表示行轴中的字段,返回PivotAxis对象。
XMLData
属性
设置或返回当前用于PivotTable报表控件的XML数据。
有关报表的细节(格式和数据)均保存在XML数据中。
也包括了OLAP连接详细信息。
AddCustomGroupField
方法
为指定的PivotFieldSet添加一个定制的分组字段。
AddCustomGroupMember
方法
为指定的PivotFieldSet添加一个定制的分组成员。
InsertFieldSet
方法
在行或列轴中插入一个字段集。
CommandExecute
事件
在某个命令执行之后触发,ChartCommandIdEnum和PivotCommandId常量包含用于每个OWC组件所支持的命令清单。
Query
事件
PivotTable激活某个查询时触发。
Figure6ChartComponent'sProgrammaticInterface
成员
类型
描述
DataSource
属性
为Chart控件定义数据源。
当设置另一个控件(如:
PivotTable或Spreadsheet)这样有效地绑定Chart控件到其它控件。
Type
属性
象ChartChartTypeEnum枚举所定义的那样定义图表类型,默认类型为条形图。
Figure8ConnectingtoanOLAPDataSource
functioninitializePivotTable(strDataMember){
//ThisfunctioncallstheInitializePivotTableXML()Web
//method
variCallID=service.svcOLAP.callService
(onInitializePivotTableResult,
'InitializePivotTableXML',
strDataMember);
}
functiononInitializePivotTableResult(result){
//ThisfunctionhandlestheInitializePivotTableXML()
//Webmethodresult
text=result.value;//resultstring
//Evaluatereturnresult
if(!
result.error){
//AssigntheXMLtothePivotListXMLDatavalue
frm1.PivotTable1.XMLData=text;
}
else{
alert("Unhandlederror-"+result.errorDetail.code+
""+result.errorDetail.string);
}
}
Figure9GenerateXMLDataforaPivotTableControl
PublicFunctionInitializePivotTableXML(ByVal_
strDataMemberAsString)AsString
Dimm_XMLAsString
DimstrOLAPConnAsString=_
ConfigurationSettings.AppSettings("OLAPConnectionString")
Try
DimobjPTAsPivotTableClass=NewPivotTableClass
objPT.ConnectionString=strOLAPConn
objPT.DataMember=strDataMember
m_XML=objPT.XMLData
objPT=Nothing
CatcherrAsException
m_XML=""&err.Source&"-"&err.Message&_
""
Finally
EndTry
Return(m_XML)
EndFunction
Figure10LoadCustomPivotTableReportWebMethod
PublicFunctionLoadCustomPivotTableReport(ByVal_
strCity1AsString,ByValstrCity2AsString)AsString
Dimm_XMLAsString
DimstrOLAPConnAsString=_
ConfigurationSettings.AppSettings("OLAPConnectionString")
DimobjPTAsPivotTableClass=NewPivotTableClass
DimobjPTViewAsPivotView
DimfldCity,fldName,fldProdFamilyAsPivotField
DimfSetCustomers,fSetProductAsPivotFieldSet
Try
objPT.ConnectionString=strOLAPConn
objPT.DataMember="Sales"
objPT.AllowFiltering=False
objPTView=objPT.ActiveView
objPTView.TitleBar.Caption="CityComparisonofDrink
Sales"
'Definethecolumnelements
objPTView.ColumnAxis.InsertFieldSet(objPTView.FieldSets("Time"))
objPTView.ColumnAxis.FieldSets("Time").Fields("Year").Expanded=True
'Definetherowelements
fSetCustomers=objPTView.FieldSets("Customers")
objPTView.RowAxis.InsertFieldSet(fSetCustomers)
fSetCustomers.Fields("Country").IsIncluded=False
fSetCustomers.Fields("StateProvince").IsIncluded=False
fSetCustomers.Fields("Name").IsIncluded=False
'Definethemembersoftherowelements
fldCity=fSetCustomers.Fields("City")
fldCity.IncludedMembers=NewObject(){strCity1,strCity2}
'Excludeallotherfieldrowmembersinthefieldset
fSetProduct=objPTView.FieldSets("Product")
objPTView.RowAxis.InsertFieldSet(fSetProduct)
fSetProduct.Fields("ProductDepartment").IsIncluded=False
fSetProduct.Fields("ProductCategory").IsIncluded=False
fSetProduct.Fields("ProductSubcategory").IsIncluded=False
fSetProduct.Fields("BrandName").IsIncluded=False
fSetProduct.Fields("ProductName").IsIncluded=False
fldProdFamily=fSetProduct.Fields("ProductFamily")
fldProdFamily.IncludedMembers="Drink"
'Definethemeasures
objPTView.DataAxis.InsertTotal(objPTView.Totals("StoreSales"))
objPTView.DataAxis.Totals("StoreSales").NumberFormat=_
"Currency"
'ReturntheXMLdatatotheclientsidescript
m_XML=objPT.XMLData
objPT=Nothing
CatcherrAsException
m_XML=""&err.Source&"-"&err.Message&""
Finally
EndTry
Return(m_XML)
EndFunction
Figure11LoadtheXMLDataforaCustomReport
functionLoadSavedReport(){
//Purpose:
CallWebServicemethodtoloadthesaved
//report
variCallID=service.svcOLAP.callService(onLoadSavedReportResult,
'LoadSavedReport','OLAPReport1.xml');
}
functiononLoadSavedReportResult(result){
//Purpose:
Thisfunctionhandlesthe
//wsOLAP.onLoadSavedReportResult()WebServiceresult
vartext=result.value;//resultstring
//Evaluatereturnresult
if(!
result.error){
//AssigntheXMLtothePivotListXMLDatavalue
frm1.PivotTable1.XMLData=text;
}
}
Figure12JavaScriptandVBScriptEventHandler
{
varsLog=document.Form1.Text1.value+"";
document.Form1.Text1.value="QueryEventFired."+sLog;
}
SubPivotTable1_CommandExecute(Command,Succeeded)
DimptConstants
SetptConstants=document.Form1.PivotTable1.Constants
'ChecktoseeifthePivotTablelisthasbeen
'refreshed.
IfCommand=ptConstants.plCommandRefreshThen
'Writethecurrentdataandtimetothetextbox.
document.Form1.Text1.value=vbCrLf&_
"PivotTableLastRefreshedon"&Date&"at"_
&Time&vbCrLf&document.Form1.Text1.value
EndIf
EndSub
Figure13CreatingCustomGroups
PublicFunctionApplyCustomGrouping(ByVal_
strReportXMLDataAsString)AsString
Dimm_xmlAsString
DimobjPTAsPivotTableClass=NewPivotTableClass
DimobjPTViewAsPivotView
DimfsTimeAsPivotFieldSet
DimfsHalfYearAsPivotField
Try
objPT.XMLData=strReportXMLData
objPTView=objPT.ActiveView
'SetavariabletotheTimefieldset.
fsTime=objPTView.FieldSets("Time")
'Addacustomgroupfieldnamed"Group1"totheTimefield
'set.
fsHalfYear=fsTime.AddCustomGr
 升级会员
升级会员 