价格形态百科双顶底2.docx
《价格形态百科双顶底2.docx》由会员分享,可在线阅读,更多相关《价格形态百科双顶底2.docx(35页珍藏版)》请在冰豆网上搜索。
价格形态百科双顶底2
12、DoubleBottom
RESULTSSNAPSHOT
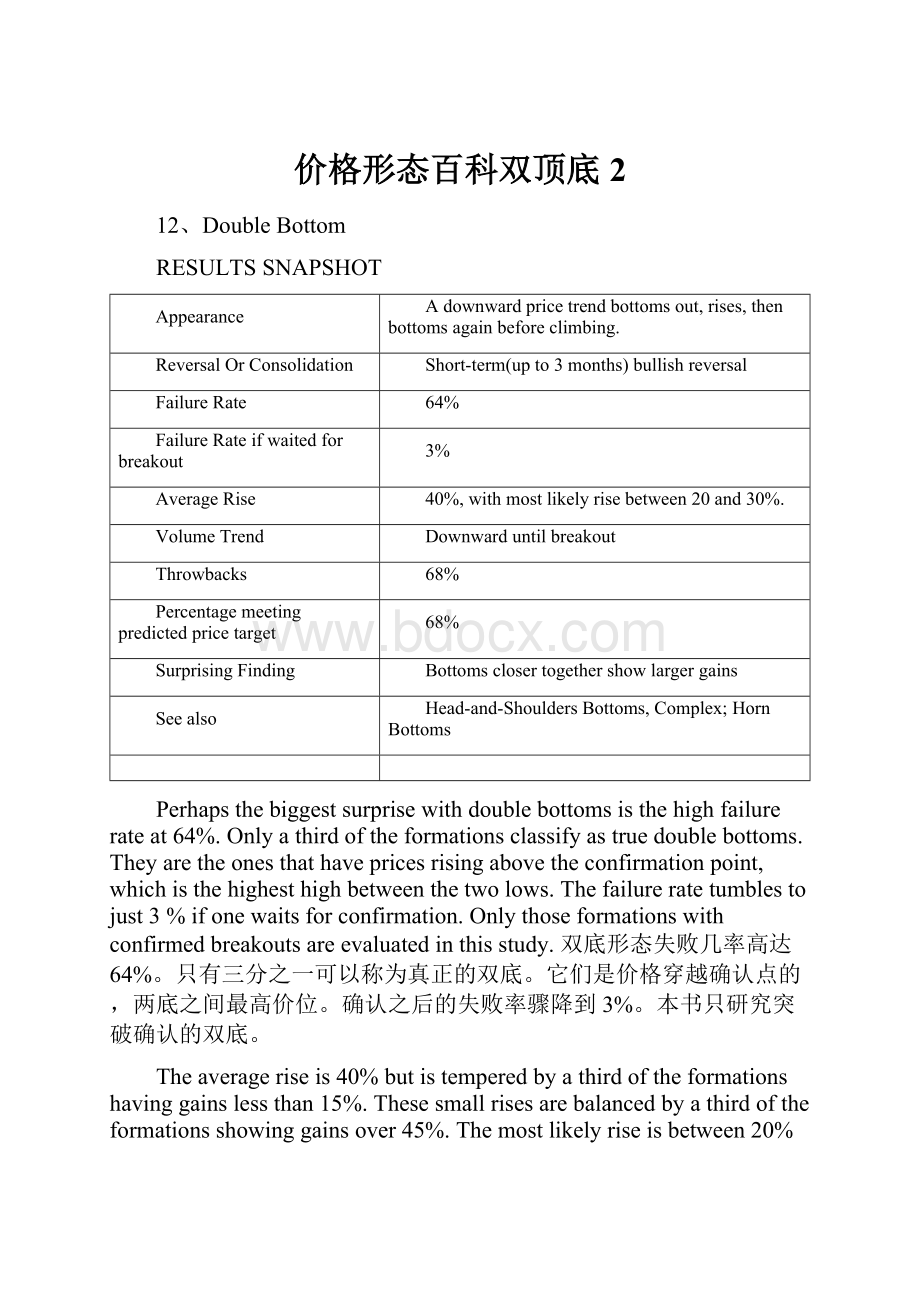
Appearance
Adownwardpricetrendbottomsout,rises,thenbottomsagainbeforeclimbing.
ReversalOrConsolidation
Short-term(upto3months)bullishreversal
FailureRate
64%
FailureRateifwaitedforbreakout
3%
AverageRise
40%,withmostlikelyrisebetween20and30%.
VolumeTrend
Downwarduntilbreakout
Throwbacks
68%
Percentagemeetingpredictedpricetarget
68%
SurprisingFinding
Bottomsclosertogethershowlargergains
Seealso
Head-and-ShouldersBottoms,Complex;HornBottoms
Perhapsthebiggestsurprisewithdoublebottomsisthehighfailurerateat64%.Onlyathirdoftheformationsclassifyastruedoublebottoms.Theyaretheonesthathavepricesrisingabovetheconfirmationpoint,whichisthehighesthighbetweenthetwolows.Thefailureratetumblestojust3%ifonewaitsforconfirmation.Onlythoseformationswithconfirmedbreakoutsareevaluatedinthisstudy.双底形态失败几率高达64%。
只有三分之一可以称为真正的双底。
它们是价格穿越确认点的,两底之间最高价位。
确认之后的失败率骤降到3%。
本书只研究突破确认的双底。
Theaverageriseis40%butistemperedbyathirdoftheformationshavinggainslessthan15%.Thesesmallrisesarebalancedbyathirdoftheformationsshowinggainsover45%.Themostlikelyriseisbetween20%and30%,relativelyhighforbullishformations.平均涨幅40%。
三分之一收益低于15%。
三分之一超过45%。
最常见的是20%-30%。
Throwbacksoccur68%ofthetime,suggestingitiswisetowaitforathrowbackandinvestoncepricesturnupward.Insomecases,waitingforathrowbackcansaveyoufrommakinganunprofitabletrade.68%的情况下会发生回调。
明智的策略师等待回调然后介入。
Asurprisingfindingisthatbottomsclosertogetheroutperformthosespacedfartherapart.TheStatisticssectionofthischapterexaminesthisinmoredetail.一个令人惊奇的发现是底部接近的双底表现比疏远的要好。
Tour
Whatdoesadoublebottomlooklike?
Figure12.1showsagoodexampleofadoublebottom.Pricesreachahighinmid-Marchthenheadlower.Forthenext3months,pricescontinuedowninasteadydeclinetodielowinJune.Volumepicksupaspricesnearthelowthenpegthemeteratover1.1millionsharesonJune18,thedaypricesreachalowof12.69.FromtheMarchhigh,thestockdeclines47%in3months.Thehighvolumemarkstheturningpointandthestockmovesupward.However,aretestofthelowisinstoreandpricesroundoverandheaddownagain.InlateAugust,pricesmakeanotherlowwhenthestockdropsto13.06,alsoonhighvolume.Thedayafterthelow,onaburstofbuyingenthusiasm,thestockjumpsupandreachestheconfirmationpointinjust2days.Insteadofcontinuingupward,however,thestockthrowsbacktothebreakoutpointandmoveshorizontallyforjustoveraweekbeforeresumingitsmoveupward.BylateJanuary,thestockreachesahighof267/8,againof75%fromthebreakoutprice.双底长什么样?
图12.1是一个很典型的双底。
价格在三月中旬形成头部,之后三个月一路下行,在六月止于极低。
六月18日,价格到达12.69,从三月的最高点算起,三个月内该股下跌了47%。
高成交量也标志着反转的出现,股价开始上行。
然后,价格在再次探底前形成又一个头部。
八月底,价格在13.06跌出另一个低点,伴随着高成交量。
低点之后,随着疯狂的买入,股价跳升,两天后即冲到确认点。
然而,在继续爬升前,股价突破后回调,横向运动一周多。
一月底,该股达到了267/8,从确认点算起涨了75%。
Figure12.1showsadoublebottomandthegainsachievedbysuchaformation.Aretherekeyelementsthatmakeupadoublebottom?
Yesandadiscussionofthekeyelementsfollowsinthenextsection.图12.1展示了双底的形态和其收益。
双底有什么决定性要素吗?
是的,随后的章节中进行讨论。
Table12.1
IdentificationCharacteristicsofDoubleBottoms
Characteristic
Discussion
Downwardpricetrend
价格趋势向下
Pricestrenddown(shortterm)andshouldnotdriftbelowtheleftbottom.价格趋势向下(短期)但不会突破左底价位。
Risebetweenbottoms
两底之间价格上升
Thereshouldbea10%to20%rise(ormore)betweenthetwobottoms,measuredfromlowtohigh.Peaksclosetogethertendtobeatthelowerendoftherange.Theriseusuallylooksroundedbutcanbeirregular.两底之间的反弹高点至少要有10%-20%的涨幅
Dualbottoms
双底
Bottomtobottompricevariationis4%orless.Thisisnotcrucialexceptthatthetwobottomsshouldappearnearthesamepricelevel.两个底部的价格相差不超过4%。
不过并非严格规定,但两个底部应该价格接近。
Bottomdistance
底部距离
Bottomsshouldbeatleastafewweeksapart(manyconsideramonthtobetheminimum),formedbytwoseparateminorlows(notpartofthesameconsolidationarea).Minimumbottomseparationisnotcriticalasthebestgainscomefromformationswithbottomsabout3monthsapart,onaverage.两个底部至少应相隔数周
Pricesriseafterrightbottom.
右底之后价格上升
Afterthesecondbottom,pricesmustriseabovetheconfirmationpointwithoutfirstfallingbelowtherightbottomlow.在第二个底部形成后,价格必须越过确认点,并且不在跌破右底
Bottomvolume
底部成交量
Usuallyhigherontheleftbottomthantheright.左底通常比右底成交量高
Breakoutvolume
突破成交量
Volumeusuallyrisessubstantially.成交量通常极大
Confirmationpoint
确认点
Theconfirmationpointisthehighesthighbetweenthetwobottoms.Itconfirmsthatatwinbottomformationisatruedoublebottom.Abreakoutoccurswhenpricesriseabovetheconfirmationpoint.确认点是两底之间的最高点。
它确认了两个底部的形态是双底。
价格穿越确认点称为突破。
IdentificationGuidelines
Notanytwobottomsatthesamepricelevelwillsufficeforadoublebottom.ListedinTable12.1areanumberofguidelinesthatmakecorrectselectioneasier.Whileconsideringtheguidelines,lookatFigure12.2.Thestockbeginsdeclininginmid-October1993fromapriceofabout561/2.Itbottomsoutatabout411/2inmid-May.Pricesneverdropbelowtheleftlowonthewaytothebottom.Thereasonforthisguidelineisthatyoushouldusethetwolowestminorlowsondiepricechart.Donottrytoselectonelowthenanearbylowjusttosatisfytheguidelines.ThetwopointsmarkedAandBinFigure12.2representanincorrectlyselecteddoublebottombecausepointAhaslowerlowstodieleftofit.并非所有两个底部且在同一价位的形态都可以称为双底,表12.1的一系列准则有助识别。
思考指南的同时,对照图12.2。
该股1993年十月中旬从561/2开始下跌。
1994年五月中旬在411/2触底。
在到达该底价之前价格从未更低过。
这条准则的意义是要求选择图上最低的两个点。
不要试图选取一个低点和附近的另一个地点来满足条件。
图12.2中A和B不正确是因为A左边有更低的点存在。
Therisebetweenthetwobottomsshouldclimbatleast10%,asmeasuredfromthelowatthebottomtotherisehigh.Theconfirmationpointisdiehighesthighbetweenthetwobottoms,anditisusedtocalculatethemeasureruleandtogaugethebreakoutprice(moreaboutdiatlater).Figure12.2showsarisefromtherightbottom,at415/32,toahighof471/2.Thatisariseof15%,wellabovethe10%threshold.双底之间的涨幅至少需要10%,从底部到爬升顶部测算。
确认点是双底之间的最高点。
该点用于测量规则和突破确认。
图12.2的右底是415/32,到高点471/2,涨幅是15%,大于阈值10%。
Thebottomtobottompricevariationshouldbe4%orless.Thebasicruleisthatthetwobottomsshouldappeartobenearoneanotheronthepricescale.Figure12.2showsapricevariationofabout1%.双底的价格差别应低于4%。
基本原则是二者的价格应该在一个价格量级上。
图12.2中差别是1%。
Thetwobottomsshouldbeatleastafewweeksapartbutareoftenseparatedbymanymonths,asshowninFigure12.2.Iseta10-dayminimumasdiestandardforselectionsinthisstudy(15daysbetweenturnsouttobethemeasuredminimumforalldoublebottomshithisstudy).Amonthistheminimumseparationthatmanyprofessionalsviewasleadingtopowerfulrallies.Isetalowerstandardtohelpverifydiatthisistrue.Itturnsoutthatpeaksclosetogetherperformbetterthanthosespacedfartherapart.Ilimitedthemaximumseparationtoaboutayear(thewidesthadaseparationof374days).双底的时间间隔至少应为数周,但经常相隔数月。
我在研究中设定10天为最低标准,最长不超过1年。
其他一些专家认为1个月是最低。
事实证明低谷离得较近的双底表现的比疏远的要好。
Manyoftheidentificationguidelinesarearbitraryandtheclassicdefinitionofadoublebottomhasdifferentones.Theclassicdefinitionsaysthatthetwobottomsshouldbeatleast1monthapart,separatedbylessthana3%pricevariation,andhaveaconfirmationpointthatrises20%abovethelow(bottomsclosertogetherhavesomewhatlowerconfirmationpoints).Therisebetweenthetwotroughsshouldlookrounded.经典的双底定义与我的有所不同。
经典定义要求双底相聚至少1个月,价差不超过3%,确认点要高与底部20%以上(相聚近的双底确认点也低些),双底间的山峰须成圆形。
Iexaminedtheperformancedifferencebetweenmydefinitionandtheclassiconeandoptimizedtheparameterstoachievethebestperformance.WhatIdiscoveredisthatthereisnomeaningfulperformancedifferencebetweenthevarioussettings,soIusedthelessstringentguidelinesinthestatisticalevaluation(10-dayminimumseparation,4%pricevariation,10%minimumrisetotheconfirmationpoint).我检查了我的标准与经典标准的不同,优化参数以实现更好的表现。
我发现不同定义在实际表现上并没有太大的区别,因此,保留了略为宽松的标准(10天,4%,10%)。
Adoublebottomisnotatruedoublebottomuntilpricesriseabovetheconfirmationpoint.Intabulatingthestatistics,/onlycountthosedoublebottomsinwhichpricesriseabovetheconfirmationpoint.Why?
Becauseofthehighfailurerate:
64%.Therewere980formationsthatlookedlikedoublebottoms,buttheirpricetrendseventuallymovedbelowthesecondbottom.Anadditional525formationsperformedasexpectedbyrisingtotheconfirmationpointandcontinuinghigher.Ifyoubuyastockjustafterittouchesthesecondbottom,yourchancesofhavingasuccessfultradeareoneinthree.Inotherwords,waitforpricestoriseabovetheconfirmationpoint.价格突破确认点之后双底才是真正的双底。
在统计中,我只计算了价格突破确认点的双底。
为何?
因为双底的超高失败率-64%。
总计有980个图形看起来像双底,但是价格最终向下跌破右底。
另外的525个形态表现的如预期突破确认点然后涨的更高。
如果在价格刚刚触及右底时买入,成功机会只有三分之一。
换言之,一定要等价格突破确认点。
Thevolumechartfordoublebottomsusuallyshowsthehighestvolumeoccurringontheleftbottom.Diminishedvolumeappearsontherightbottom,andthevolumetrendoftheoverallformationisdownward.Noneoftheseareabsoluterules.Sometimesvolumeishighestontherightbottominsteadofdieleft.However,onaverage,mostoftheformationsobeytheguidelines.成交量图表显示,左底最高,右底低于左底,成交量呈下降趋势。
不过这并非绝对规则。
最大成交量有时出现在右底。
不过多数情况下在左底。
Thebreakoutvolumeishigh,usuallywellabovethepriorday'svolumeandabovetheaveragevolumeaswell.Again,thisisnotaninviolaterulesoexpectexceptions.突破时成交量高与前一天和平均值。
同样的,这也不是绝对要求。
Whydodoublebottomsform?
Toanswerthatquestion,considerthedoublebottomshowninFigure12.3.Pricesreachahighinmid-April1993andmovehorizontallyuntilnervousnesssets
 升级会员
升级会员 