西南交大机电工程可视化大作业.docx
《西南交大机电工程可视化大作业.docx》由会员分享,可在线阅读,更多相关《西南交大机电工程可视化大作业.docx(56页珍藏版)》请在冰豆网上搜索。
西南交大机电工程可视化大作业
1.1
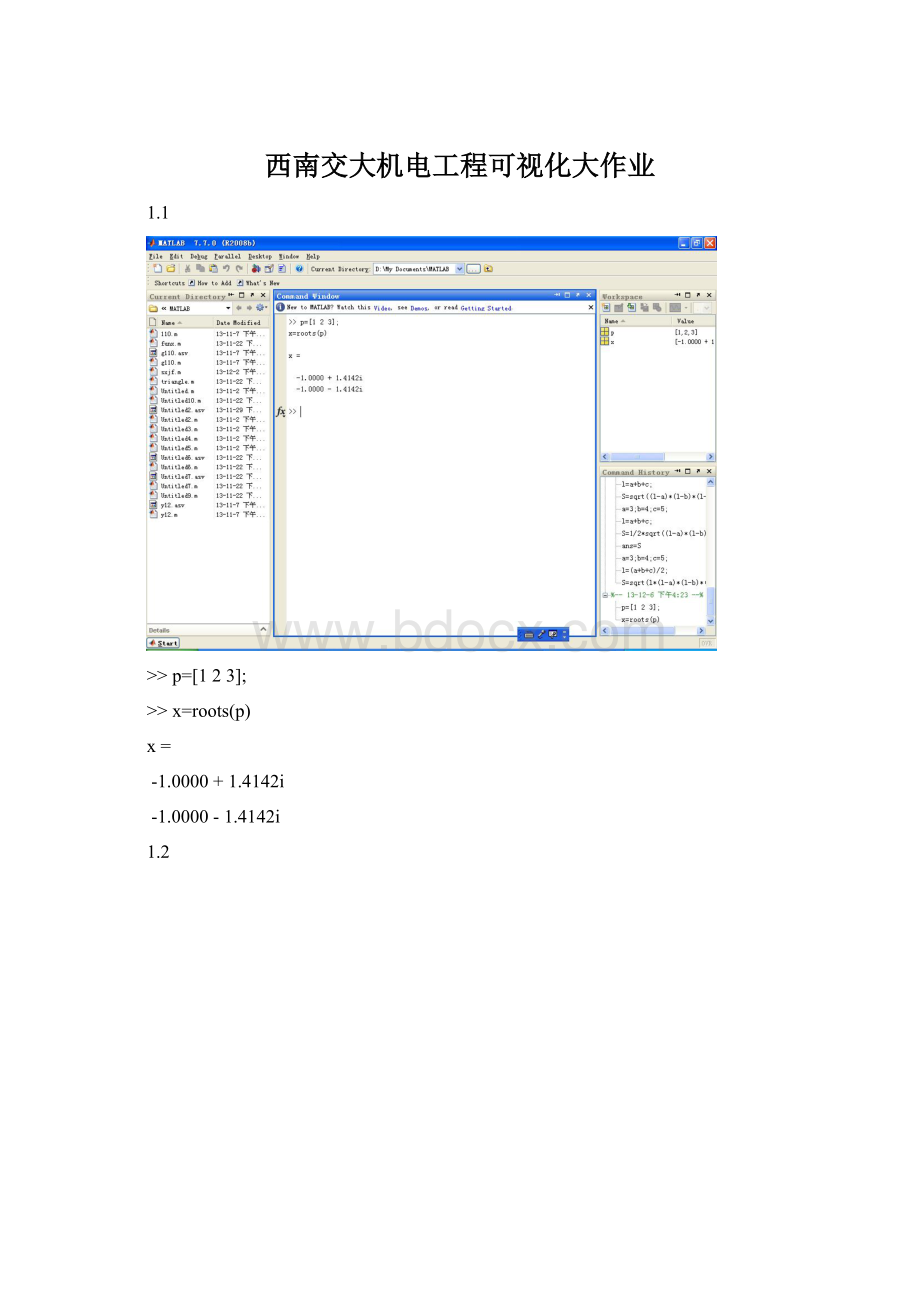
>>p=[123];
>>x=roots(p)
x=
-1.0000+1.4142i
-1.0000-1.4142i
1.2
>>a=3;b=4;c=5;
l=(a+b+c)/2;
S=sqrt(l*(l-a)*(l-b)*(l-c))
S=
6
1.3
>>A=[1,2,0;1,3,1;0,1,2];
B=[1,0;0,1;-1,0];
x=inv(A+2)*B
x=
1.2857-1.4286
-0.42861.1429
-0.5714-0.1429
1.4
>>x=1:
19/9:
20
x=
Columns1through7
1.00003.11115.22227.33339.444411.555613.6667
Columns8through10
15.777817.888920.0000
>>y=x
(2)
y=
3.1111
>>x([123])=[456]
x=
Columns1through7
4.00005.00006.00007.33339.444411.555613.6667
Columns8through10
15.777817.888920.0000
>>z=x(5:
-1:
1)
z=
9.44447.33336.00005.00004.0000
>>t=z(2:
end)
t=
7.33336.00005.00004.0000
2.1
>>A=[-5,0,1;2.6,1,2;0,8,1];
>>B=[4,2.5,0,;0,6,0;-1.2,0,1];
>>ans=A&B
ans=
100
010
001
>>ans=A|B
ans=
111
111
111
>>ans=~A
ans=
010
000
100
2.2
>>A=[2,1,0;1,2,1;0,1,2];
>>det(A)
ans=
4
>>inv(A)
ans=
0.7500-0.50000.2500
-0.50001.0000-0.5000
0.2500-0.50000.7500
>>E=eig(A)
E=
0.5858
2.0000
3.4142
>>[L,U]=lu(A)
L=
1.000000
0.50001.00000
00.66671.0000
U=
2.00001.00000
01.50001.0000
001.3333
2.3
>>a=[912;563;827];
>>[L,U]=lu(a)
L=
1.000000
0.55561.00000
0.88890.20411.0000
U=
9.00001.00002.0000
05.44441.8889
004.8367
>>[Q,R]=qr(a)
Q=
-0.69030.3969-0.6050
-0.3835-0.9097-0.1592
-0.61360.12210.7801
R=
-13.0384-4.2183-6.8260
0-4.8172-1.0807
003.7733
>>R=chol(a)
R=
3.00000.33330.6667
02.42671.1447
002.2903
2.4
>>A=[-4,-2,0,2,4;-3,-1,1,3,5];
>>A(find(A>4))
ans=
5
2.5.1
>>A=[1234;3456;5678;7890]
A=
1234
3456
5678
7890
>>B=A(1,2)
B=
2
2.5.2
>>C=A(:
3)
C=
3
5
7
9
2.5.3
>>D=A(1:
3,[24])
D=
24
46
68
2.5.4
>>A'
ans=
1357
2468
3579
4680
2.5.5
>>fliplr(A)
ans=
4321
6543
8765
0987
>>flipud(A)
ans=
7890
5678
3456
1234
2.5.6
>>rot90(A,3)
ans=
7531
8642
9753
0864
2.5.8
>>triu(A,-1)
ans=
1234
3456
0678
0090
2.5.9
>>diag(A,2)
ans=
3
6
2.5.10
>>zeros(size(A))
ans=
0000
0000
0000
0000
>>ones(size(A))
ans=
1111
1111
1111
1111
2.5.12
>>A=[1234;3456;5678;7890]
A=
1234
3456
5678
7890
>>A(:
)=1:
0.5:
8.5
A=
1.00003.00005.00007.0000
1.50003.50005.50007.5000
2.00004.00006.00008.0000
2.50004.50006.50008.5000
2.5.13
>>A(:
[13])=[]
A=
24
46
68
80
2.6.1
>>a=[42;75];
>>b=[71;83];
>>c=[59;62];
>>A=[a(1:
end);b(1:
end);c(1:
end)]
A=
4725
7813
5692
>>A'
ans=
475
786
219
532
2.6.2
>>A=[a(1:
end),b(1:
end),c(1:
end)]
A=
472578135692
3.1
a=input('a=?
')
b=input('b=?
')
c=input('c=?
')
p=[abc]
x=roots(p)
保存命令文件x1x2.m
>>x1x2
a=?
1
a=
1
b=?
2
b=
2
c=?
3
c=
3
p=
123
x=
-1.0000+1.4142i
-1.0000-1.4142i
3.2
price=input('请输入商品价格:
')
a=fix(price/100)
ifa>=0&a<2
rate=0
elseifa>=2&a<5
rate=3/100
elseifa>=5&a<10
rate=5/100
elseifa>=10&a<25
rate=8/100
elseifa>=25&a<50
rate=10/100
else
rate=14/100
end
price=price*(1-rate)
保存命令文件priceresult.m
>>priceresult
请输入商品价格:
500
price=
500
rate=
0.0500
price=
475
3.3
A=magic(3)
N=input('N=?
')
try
A(N,:
)
catch
A(end,:
)
end
A
Lasterr
3.4
clear
n=input('输入参数数目:
')
ifn==1
x1=input('输入参数x1:
')
m=input('输出参数数目:
')
ifm==1
y1=x1
elseifm==2
y1=x1/2
y2=x1/2
else
end
elseifn==2
x1=input('输入参数x1:
')
x2=input('输入参数x2:
')
m=input('输出参数数目:
')
ifm==1
y1=x1+x2
elseifm==2
y1=(x1+x2)/2
y2=(x1+x2)/2
else
end
else
end
保存命令文件x1x2.m
>>x1x2
输入参数数目:
2
n=
2
输入参数x1:
5
x1=
5
输入参数x2:
6
x2=
6
输出参数数目:
2
m=
2
y1=
5.5000
y2=
5.5000
3.5
clear
s=0
forn=1:
50
s=s+n*(n+1)
end
s
保存命令文件sum.m
>>sum
s=
44200
4.1
>>num=100;
out_array=randn(1,1000000);
tic;
forii=1:
num
[fid,msg]=fopen('unformatted.dat','w');
count=fwrite(fid,out_array,'float64');
status=fclose(fid);
end
fprintf('Binaryfile=%6.3f\n',toc);
tic;
forii=1:
num
[fid,msg]=fopen('formatted.dat','wt');
count=fprintf(fid,'%23.15e\n',out_array);
status=fclose(fid);
end
fprintf('ASCIIfile=%6.3f\n',toc);
Binaryfile=0.845
ASCIIfile=170.775
5.1
>>x=0:
pi/100:
2*pi;
>>y1=sin(2*x);
>>plot(x,y1)
>>holdon
>>y2=cos(x);
>>plot(x,y2);
>>holdoff
5.2
>>[x,y]=meshgrid(-8:
0.5:
8);
>>z=sin(sqrt(x.^2+y.^2))./sqrt(x.^2+y.^2);
>>mesh(x,y,z)
5.3
>>subplot(1,2,1);
>>x=[6649715638];
>>pie(x);
>>title('饼图');
>>subplot(1,2,2);
>>pie([x
(2),x(5)]);
>>title('二五');
5.5
>>[x,y]=meshgrid(0:
pi/100:
pi);
>>z=sin(pi*sqrt(x.^2+y.^2));
>>mesh(x,y,z)
5.6
>>x=-2*pi:
pi/100:
2*pi;
>>y=-sin(-1*pi/3*x);
>>plot(x,y)
>>title('Plotofsin(\theta)');
>>xlabel('-\pi\leq\theta\leq\pi');
>>ylabel('sin(\theta)');
>>text(-0.5,-0.6,'-sin(-\pi/3x)');
5.7
>>[x,y]=meshgrid(-2:
0.1:
2);
>>z=x*exp(-x.^2-y.^2);
>>subplot(2,2,1);
>>surf(x,y,z);
>>subplot(2,2,2);
>>mesh(x,y,z);
>>subplot(2,2,3);
>>surf(x,y,z);shadingflat;
>>subplot(2,2,4);
>>surf(x,y,z);
>>light('posi',[1,1,2]);
>>shadinginterp;
5.8
>>t=0:
0.5:
10;
>>y1=exp(-0.1*t);
>>y2=exp(-0.2*t);
>>y3=exp(-0.3*t);
>>plot(t,y1,t,y2,'k:
',t,y3,'bp');
>>text(3,0.3,'a=0.3');
>>text(6,0.3,'a=0.2');
>>text(8.6,0.5,'a=0.1');
5.9
>>[x,y,z]=peaks(30);
>>surf(x,y,z);shadingflat;
>>colormap(copper);
6.1
>>P=(x-1)*(x-2)*(x-3)*(x-4);
Y=polyval(P,8)
Y=
840
6.2
>>x=0:
0.02*pi:
2*pi;
>>Y=sin(x);
>>max(Y)
ans=
1
>>min(Y)
ans=
-1
>>mean(Y)
ans=
2.2995e-017
>>std(Y)
ans=
0.7071
6.3
>>A=[1,1;2,4];
>>b=[36,100]';
>>x=A\b
x=
22
14
6.4
>>x=[204-50];
y1=polyval(x,1)
y1=
1
>>y2=polyval(x,2)
y2=
38
>>y3=polyval(x,3)
y3=
183
>>y4=polyval(x,4)
y4=
556
>>A=[12;34];
>>y5=polyval(x,A)%对矩阵中各个元素的值
y5=
138
183556
>>y6=polyvalm(x,A)%对矩阵的值
y6=
421610
9151336
6.5
>>h=6:
2:
18;
>>t=[18202225302824;15192428343230]';
>>X1=6.5:
2:
17.5
>>Y1=interp1(h,t,X1,'spline')
X1=
6.50008.500010.500012.500014.500016.5000
Y1=
18.502015.6553
20.498620.3355
22.519324.9089
26.377529.6383
30.205134.2568
26.817830.9594
7.1
>>f=sym('ae^x+bsinx')
f=
ae^x+bsinx
7.2
>>symsxy
7.3
>>f=3*x^2+5*x+2
f=
3*x^2+5*x+2
%表达式
>>f='3*x^2+5*x+2'
f=
3*x^2+5*x+2
%单引号生成符号表达式
>>x=sym('x');
>>f=3*x^2+5*x+2
f=
3*x^2+5*x+2
%syms函数定义符号表达式
7.4
>>symsx1x2;
>>x1=pi/3;
>>x2=pi/6;
>>eval('f1=(sin(x1)*cos(x2)-cos(x1)*sin(x2)');
f1=
0.5000
>>eval('f2=sin(x1-x2)');
f2=
0.5000
7.5.1
>>symsx;
f=log(sin(x))/(pi-2*x)^2;
>>limit(f,x,pi/2)
ans=
-1/8
7.5.2
>>symsx;
>>f=5*x*x/(1-x*x)+2^(1/x);
>>limit(f,x,inf)
ans=
-4
7.6.1
>>symst;
>>f=(1-sqrt(t))/(1+sqrt(t));
>>diff(f)
ans=
-1/2/t^(1/2)/(1+t^(1/2))-1/2*(1-t^(1/2))/(1+t^(1/2))^2/t^(1/2)
7.6.2
>>symsx;
>>f=exp(x)*cos(x);
>>diff(x)
ans=
1
7.7
>>symsxa;
>>f=[ax^21/x;exp(a*x)log(x)sin(x)];
>>diff(f,'x',1)
ans=
[0,2*x,-1/x^2]
[a*exp(a*x),1/x,cos(x)]
7.8.1
>>symsx;
f=sin(2*x)/sqrt(1+sin(x)^2);
>>int(f)
ans=
2*(1+sin(x)^2)^(1/2)
7.8.2
>>symsx;
f=exp(x^2/2);
int(f,x,0,1)
ans=
-(2^(1/2)*pi^(1/2)*erf((2^(1/2)*i)/2)*i)/2
7.9.1
>>symsx;
f=x^3;
int(f,x,0,1)
ans=
1/4
7.9.2
>>symsx;
f=(x^2)*log(x);
int(f,x,1,3)
ans=
9*log(3)-26/9
7.10
>>symsxy;
f1=x*y;
f2=int(f1,x,0,1);
f=int(f2)
f=
1/4*y^2
7.11
>>symsxy;
s=solve('a*x^2+b*y+c=0','x+y=0');
disp(s.x);
-1/2/a*(-b+(b^2-4*a*c)^(1/2))
-1/2/a*(-b-(b^2-4*a*c)^(1/2))
>>disp(s.y)
1/2/a*(-b+(b^2-4*a*c)^(1/2))
1/2/a*(-b-(b^2-4*a*c)^(1/2))
7.12
>>symst;
x=sin(3*t)*cos(t);
y=sin(3*t)*sin(t);
ezplot(x,y,[0,2*pi])
7.13
>>symsxt;
>>A=[2*xt^2;t*sin(x)exp(x)];
>>diff(A,'x')
ans=
[2,0]
[t*cos(x),exp(x)]
>>diff(A,'t')
ans=
[0,2*t]
[sin(x),0]
7.14
>>symsxyz;
s=solve('x^2+2*x+1=0','x+3*z=4','y*z=-1');
>>disp(s.x)
-1
>>disp(s.y)
-3/5
>>disp(s.z)
5/3
7.15.1
建立函数文件
functionfx=funx(x)
fx=x*2^x-1
保存funx.m
>>z=fzero('funx',0)
fx=
-1
fx=
-1.0277
fx=
-0.9712
......
7.15.2
建立函数文件
functionfx=funx(x)
fx=3*sin(x)+1-x
保存funx.m
>>z=fzero('funx',0)
fx=
1
.......
fx=
1.1102e-016
fx=
-5.5511e-016
fx=
1.1102e-016
z=
-0.5385
8.1
x=0:
pi/20:
4*pi;
y1=sin(x);
y2=cos(x);
plot(x,y1,x,y2);
get(gcf);
h=get(gcf,'children');
hh=get(gca,'children');
y11=get(hh
(1),'ydata');
y22=y11/2;
set(hh
(2),'ydata',y22)
set(hh
(1),'linestyle',':
')
set(hh
(2),'color','r')
9.1
>>x=0:
2:
24;
t=[12,9,9,10,18,24,28,27,25,20,18,15,13];
plot(x,t)
[P,S]=polyfit(x,t,7);
polyval(P,13)
ans=
27.9972
9.2
>>x=[0:
1:
610121516];
y=[172310930740030712369246];
n=9;
p=polyfit(x,y,n);
X=0:
0.1:
16;
Y=polyval(p,X)
plot(x,y,'+',X,Y)
9.3
>>x=1:
1:
5;
y=1:
1:
3;
[x,y]=meshgrid(x,y);
z=[8282808284;7963616581;8484828586];
subplot(1,2,1);
surf(x,y,z);
title('粗糙的平板表表面温度分布')
xi=0:
0.2:
5;
yi=0:
0.2:
3;
[xi,yi]=meshgrid(xi,yi);
zi=interp2(x,y,z,xi,yi);
subplot(1,2,2);
surf(xi,yi,zi)
title('平板表表面温度分布')
9.4
>>X=solve('x^2+7*x+1');
x1=X
(1);
x2=X
(2);
x=[x1:
0.1:
x2];
y=x.^2+7*x+1;
plot(x,y);
s=-int('x^2+7*x+1','x',x1,x2)
disp
s=
-(45*5^(1/2))/2
9.5
>>x=[0,300,600,1000,1500,2000];
y=[0.9689,0.9322,0.8969,0.8519,0.7989,0.7491];
xi=0:
100:
2000;
y0=1.0332*exp(-(xi+500)/7756);
yi=interp1(x,y,xi,'nearest');
n=8;
pp=polyfit(x,y,n);
yj=polyval
 升级会员
升级会员 