MATLAB实验报告.docx
《MATLAB实验报告.docx》由会员分享,可在线阅读,更多相关《MATLAB实验报告.docx(10页珍藏版)》请在冰豆网上搜索。

MATLAB实验报告
实验一名称:
连续时间信号分析
姓名:
王嘉琦学号:
201300800636班级:
通信二班
一、实验目的
(一)掌握使用Matlab表示连续时间信号
1、学会运用Matlab表示常用连续时间信号的方法
2、观察并熟悉常用信号的波形和特性
(二)掌握使用Matlab进行连续时间信号的相关运算
1、学会运用Matlab进行连续时间信号的时移、反褶和尺度变换
2、学会运用Matlab进行连续时间信号微分、积分运算
3、学会运用Matlab进行连续时间信号相加、相乘运算
4、学会运用Matlab进行连续时间信号卷积运算
二、实验条件
Matlab
三、实验内容
1、利用Matlab命令画出下列连续信号的波形图。
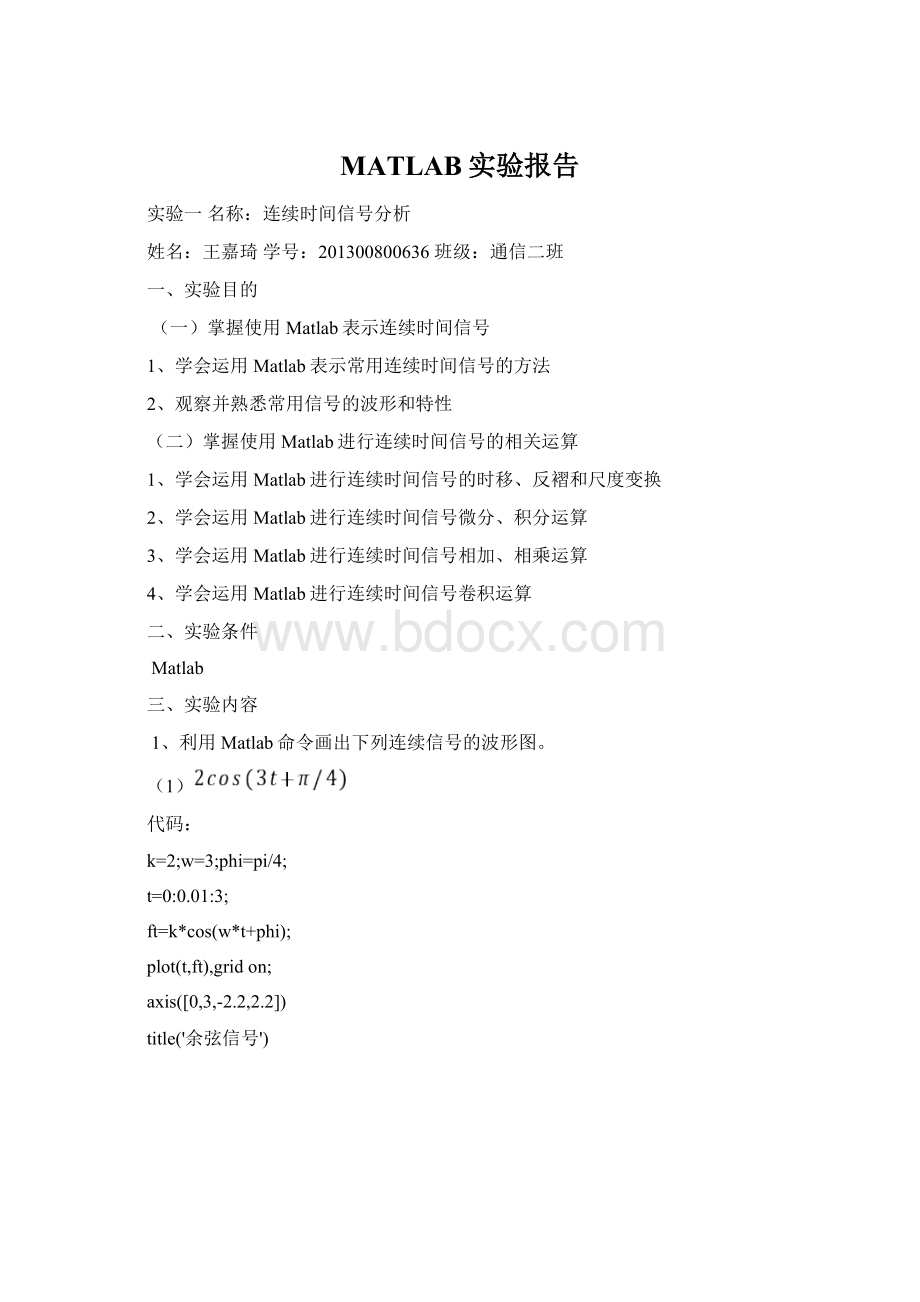
(1)
代码:
k=2;w=3;phi=pi/4;
t=0:
0.01:
3;
ft=k*cos(w*t+phi);
plot(t,ft),gridon;
axis([0,3,-2.2,2.2])
title('余弦信号')
(2)
代码:
k=-1;a=-1;
t=0:
0.01:
3;
ft=2-k*exp(a*t);
plot(t,ft),gridon
axis([0,3,2,3])
title('指数信号')
(3)
代码:
k=1;w=pi;phi=0;
t=0:
0.01:
2;
ft=1+k*cos(w*t+phi);
plot(t,ft),gridon;
axis([0,3,0,2])
title('余弦信号')
2、利用Matlab命令画出复信号
的实部、虚部、模和辐角。
代码:
t=0:
0.01:
10;
k=2;a=0;b=1;phi=pi/4;
ft=k*exp(a+i*(b*t+phi));
subplot(2,2,1);plot(t,real(ft));title('实部');axis([0,10,-2.2,2.2]);gridon;
subplot(2,2,2);plot(t,imag(ft));title('虚部');axis([0,10,-2.2,2.2]);gridon;
subplot(2,2,3);plot(t,abs(ft));title('模');axis([0,10,0,6]);gridon;
subplot(2,2,4);plot(t,angle(ft));title('相角');axis([0,10,-4,4]);gridon;
3、已知信号的波形(课本P13例题1-1),画出
的波形图。
代码:
functionf=funct1(t)
f=uCT(t+2)-uCT(t)+(-t+1).*(uCT(t)-uCT(t-1));
functionf=uCT(t)
f=(t>=0)
t=-2:
0.01:
4;
ft1=funct1(t-2);
ft2=funct1(3*t);
ft3=funct1(-t);
ft4=funct1(-3*t-2);
subplot(2,2,1)
plot(t,ft1);gridon;
title('f(t-2)');
axis([-2,4,-0.5,2])
subplot(2,2,2)
plot(t,ft2);gridon;
title('f(3t)');
axis([-2,4,-0.5,2])
subplot(2,2,3)
plot(t,ft3);gridon;
title('f(-t)');
axis([-2,4,-0.5,2])
subplot(2,2,4)
plot(t,ft4);gridon;
title('f(-3t-2)');
axis([-2,4,-0.5,2])
4、使用微分命令求
关于变量x的一阶导数;使用积分命令计算不定积分
,定积分
。
(1)
(2)
(3)
5、已知
,使用命令画出两信号和及两信号乘积的波形图。
其中,
代码:
f=1;
t=0:
0.01:
3/f;
f1=sin(2*pi*f*t);
f2=sin(2*pi*8*f*t);
subplot(2,1,1)
plot(t,f1+1,':
',t,f1-1,':
',t,f1+f2)
gridon,title('f1(t)+f2(t)')
subplot(2,1,2)
plot(t,f1,':
',t,-f1,':
',t,f1.*f2)
gridon,title('f1(t)*f2(t)')
6、用Matlab命令绘出下列信号的卷积积分
的时域波形图。
代码:
function[f,t]=ctsconv(f1,f2,t1,t2,dt)
f=conv(f1,f2);
f=f*dt;
ts=min(t1)+min(t2);
te=max(t1)+max(t2);
t=ts:
dt:
te;
subplot(2,2,1)
plot(t1,f1);gridon;
axis([min(t1),max(t1),min(f1)-abs(min(f1)*0.2),max(f1)+abs(max(f1)*0.2)])
title('f1(t)');xlabel('t')
subplot(2,2,2)
plot(t2,f2);gridon;
axis([min(t2),max(t2),min(f2)-abs(min(f2)*0.2),max(f2)+abs(max(f2)*0.2)])
title('f2(t)');xlabel('t')
subplot(2,1,2)
plot(t,f);gridon;
axis([min(t),max(t),min(f)-abs(min(f)*0.2),max(f)+abs(max(f)*0.2)])
title('f(t)=f1(t)*f2(t)');xlabel('t')
functionf=uCT(t)
f=(t>=0)
dt=0.01;t1=0:
dt:
3;
f1=uCT(t1)-uCT(t1-2);
t2=t1;
f2=uCT(t2)-uCT(t2-3)+uCT(t2-1)-uCT(t2-2);
[t,f]=ctsconv(f1,f2,t1,t2,dt);
四、实验结论和讨论
此次试验主要实践了信号与系统第一、二章的主要内容,让我们掌握了另一种独特的计算方法,更加简便。
试验是存在误差的,当可以人为地减小误差。
五、实验思考
要熟练掌握MATLAB的使用方法,以及其使用规则;
务必要在实验课之前进行预习,以保证实验效率;
在实验过程中,又不会的地方要及时询问,有质疑的地方要提出来;