matlab车道线检测.docx
《matlab车道线检测.docx》由会员分享,可在线阅读,更多相关《matlab车道线检测.docx(7页珍藏版)》请在冰豆网上搜索。

matlab车道线检测
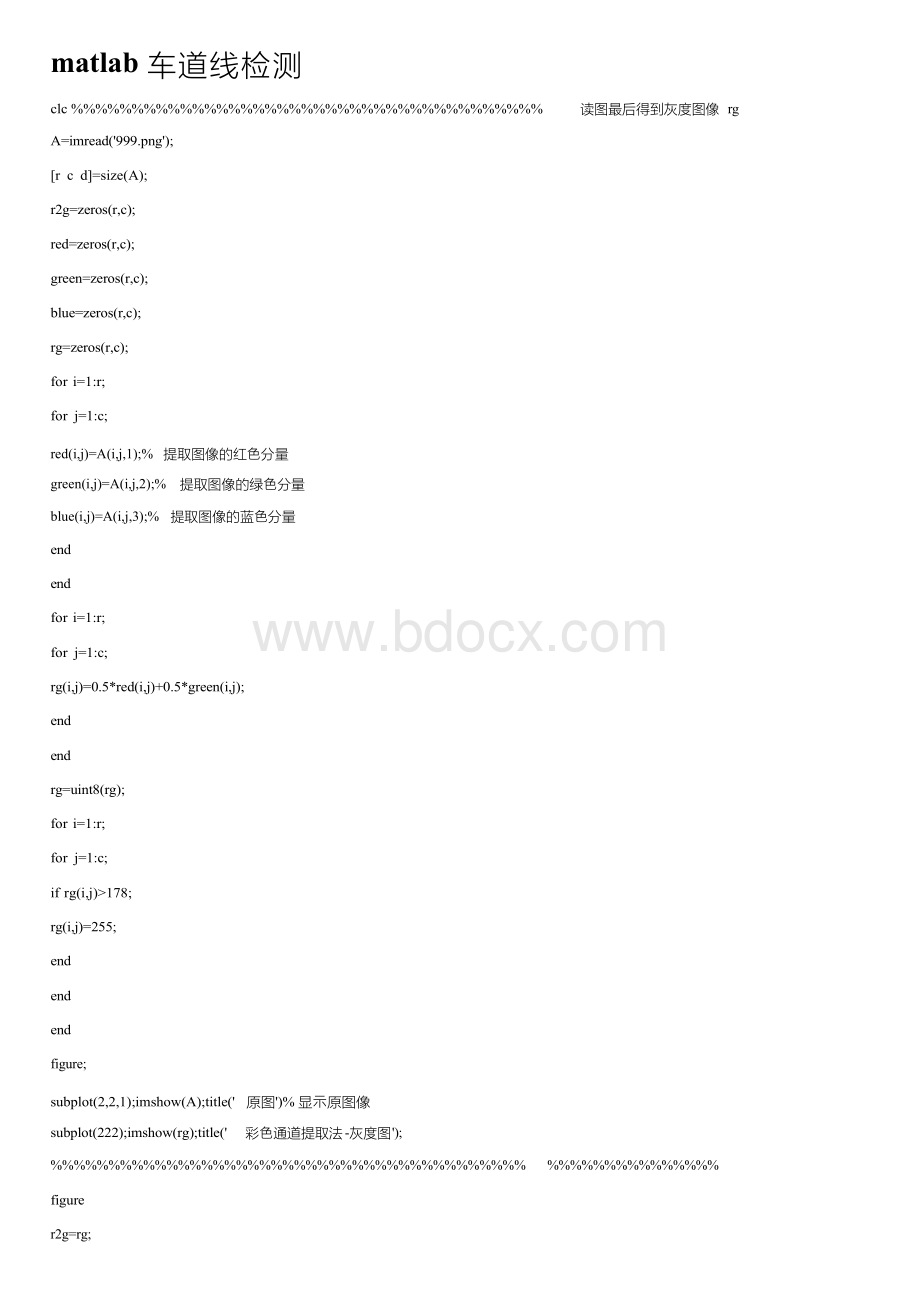
clc%%%%%%%%%%%%%%%%%%%%%%%%%%%%%%%%%%%%%%% 读图最后得到灰度图像rg
A=imread('999.png');[rcd]=size(A);r2g=zeros(r,c);red=zeros(r,c);green=zeros(r,c);blue=zeros(r,c);rg=zeros(r,c);
fori=1:
r;forj=1:
c;
red(i,j)=A(i,j,1);%提取图像的红⾊分量
green(i,j)=A(i,j,2);%提取图像的绿⾊分量
blue(i,j)=A(i,j,3);%提取图像的蓝⾊分量
endend
fori=1:
r;forj=1:
c;
rg(i,j)=0.5*red(i,j)+0.5*green(i,j);
endend
rg=uint8(rg);
fori=1:
r;forj=1:
c;
ifrg(i,j)>178;rg(i,j)=255;end
endendfigure;
subplot(2,2,1);imshow(A);title('原图')%显⽰原图像
subplot(222);imshow(rg);title(' 彩⾊通道提取法-灰度图');
%%%%%%%%%%%%%%%%%%%%%%%%%%%%%%%%%%%%%%%%%%%%%%%%%%%%%%%%
figurer2g=rg;
i=r2g;%输⼊灰度变换后的图像subplot(221);imshow(i);title('原图')subplot(223);imhist(i);%显⽰直⽅图h1=histeq(i);
subplot(222);imshow(h1);title(' 直⽅图均衡化后的图')
subplot(224);imhist(h1);%%%%%%%%%%%%%%%%%%%%%%%%%%%%%%%%%%%%%%%%%
%%%%%%%%%%%%%
i=h1;%直⽅图均衡化后的图像
j=imnoise(i,'salt&pepper',0.02)k1=medfilt2(j);
figure;
subplot(121);imshow(j);title('添加椒盐噪声图像')subplot(122);imshow(k1);title('3*3 模板中值滤波')
%%%%%%%%%%%%%%%%%%%%%%%%%%%%%%%%%%%%%%%%%%%%%%%%%%%%%%%%%
clcr2g;figure;
subplot(221);imshow(r2g);
title('原图像');
W_H1=[230;%选⽤⾃定义差分模板增强左车道标记线
30-3;
0-3-2];
W_V1=[032;%选⽤⾃定义差分模板增强右车道标记线
-303;
-2-30];
T=0.28;%thethresholdinthe2-valueI=r2g;%readtheimage
[height,width]=size(I);
I1=double(I);
I3=double(I);
I4=double(I);
I2=zeros(height+2,width+2);%puttheimage'sdataintoabiggerarraytovoidtheedgeI2(p>
fori=2:
height+1%movethewindowandcalculatethegradsforj=2:
width+1
sum3=0;%不同⽅向的模板算⼦sum4=0;
form=-1:
1forn=-1:
1
sum3=sum3+W_H1(m+2,n+2)*I2(i+m,j+n);end
end
form=-1:
1forn=-1:
1
sum4=sum4+W_V1(m+2,n+2)*I2(i+m,j+n);
endend
grey1=abs(sum3)+abs(sum4);
I3(i-1,j-1)=grey1;end
end
big=max(max(I3));%归⼀化small=min(min(I3));
fori=1:
heightforj=1:
width
I3(i,j)=(I3(i,j)-small)/(big-small);%归⼀化
if(I3(i,j)>T)
I3(i,j)=1;%⼆值化else
I3(i,j)=0;
endendend
subplot(222);
imshow(I3);title('sl、sr算⼦处理的图像')%%%%%%%%%%%%%%%%%%%%%%%%%%%%%%%%%%%%%%%%%
%%%%%
figure;subplot(221);imshow(A);title(' 原图')gg=bwmorph(I3,'thin',inf);subplot(222);imshow(gg);title(' 细化的图像')I=rg;
[x,y]=size(I);[height,width]=size(I);seedx=round(x);
seedy=round(y/2);gr=I(seedx,seedy)
W_H=[111;%themodelinthehorizondirection111;
111];
I1=double(I);
I2=zeros(height+2,width+2);%puttheimage'sdataintoabiggerarraytovoidtheedgeI2(p>
fori=2:
height+1%movethewindowandcalculatethegradsforj=2:
width+1sum1=0;%thecumulus
form=-1:
1
forn=-1:
1
sum1=sum1+W_H(m+2,n+2)*I2(i+m,j+n);end
endgrey=sum1/9;
I1(i-1,j-1)=grey;
endend
I1=uint8(I1);%邻域平均化灰度图像
%subplot(222);imshow(I1);title('区域⽣长-路⾯区域图像')[x,y]=size(I1);
I2=zeros(x,y);I=double(I);I1=double(I1);fori=1:
x;
forj=1:
y;
ifabs(I1(i,j)-I(i,j))<=70&abs(I(seedx,seedy)-I1(i,j)<=90)I2(i,j)=1;
end
endend
subplot(223)
imshow(I2);title('区域⽣长-路⾯区域图像')I4=zeros(x,y);
fori=round(5):
x-4;forj=5:
y-4;
ifgg(i,j)==1form=i-4:
i+4;forn=j-4:
j+4;
ifI2(m,n)==0&sqrt((i-m)^2+(j-n^2))<=2I4(i,j)=1;
end
endendendendend
subplot(224)
imshow(I4);title('检测图像')
%%%%%%%%%%%%%%%%%%%%%%%%%%%%%%%%%%%%%%%%%%%%%%%%%%%%%%%
clc;t0=clock
ff=I4;%输⼊检测的图像
[x,y]=size(ff);a1=zeros(x,1);b1=zeros(y,1);k=1;
fori=1:
x
forj=1:
round(y/2);ifff(i,j)==1;
a1(k)=i;
b1(k)=j;k=k+1;end
endend
m=length(a1);
a2=max(a1)h=1;
fori=1:
m;
ifa1(i)==a2;jiaobiao(h)=i;h=h+1;
endend
b1=b1(jiaobiao);b11=max(b1);
%ff(a1,b1)为选中的车道线第⼀个像素点k=1;
fori=round
(1):
round(x);forj=1:
round(y/2);
ifff(i,j)==1&i~=a2&j~=b11;kkb(k)=(b11-j)/(a2-i);bbc(k)=b11-kkb(k)*a2;k=k+1;
endendend
theta=atan(-1./kkb);theta1=theta+pi,roi=bbc.*sin(theta);roi1=roi+abs(roi);maxtheta=max(theta1);maxroi=max(roi1);
accum=zeros(round(maxtheta)+1,round(maxroi)+1);fori=1:
length(theta);thetaint=round(maxtheta/2+theta1(i)/2);
roiint=round(maxroi/2+roi1(i)/2)+1;
accum(thetaint,roiint)=accum(thetaint,roiint)+1;end
p=max(max(accum))%出现峰值处的累加器的值fori=1:
length(theta);thetaint=round(maxtheta/2+theta1(i)/2);
roiint=round(maxroi/2+roi1(i)/2)+1;ifaccum(thetaint,roiint)==p;
ji=i;
endend
k=1;m=1;
fori=round(x/2):
x;forj=1:
round(y/2);
ifff(i,j)==1&i~=a2&j~=b11;kk(k)=(b11-j)/(a2-i);bb(k)=b11-kk(k)*a2;theta(k)=atan(-1./kk(k));
iftheta(k)==theta(ji);xji(m)=i;
yji(m)=j;
m=m+1;endk=k+1;end
endend
%xji=median(xji);
%yji=median(yji);ji;
theta(ji);imshow(I4);holdon;
line([yji,b11],[xji,a2],'linewidth',3);title('根据改进的hough做标记线')time=etime(clock,t0)