价格形态百科旗形2.docx
《价格形态百科旗形2.docx》由会员分享,可在线阅读,更多相关《价格形态百科旗形2.docx(18页珍藏版)》请在冰豆网上搜索。
价格形态百科旗形2
14、FlagsandPennants
RESULTSSNAPSHOT
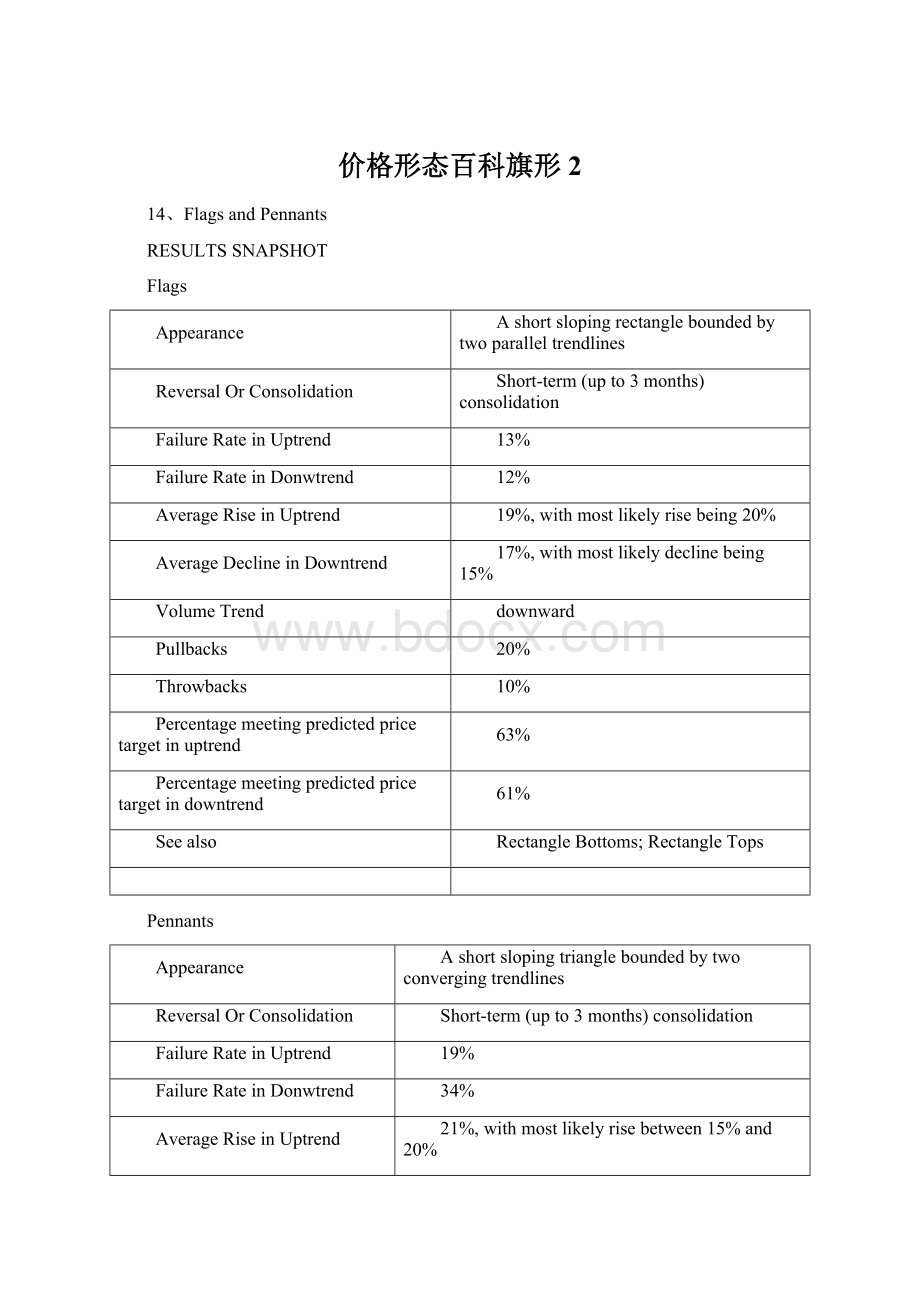
Flags
Appearance
Ashortslopingrectangleboundedbytwoparalleltrendlines
ReversalOrConsolidation
Short-term(upto3months)consolidation
FailureRateinUptrend
13%
FailureRateinDonwtrend
12%
AverageRiseinUptrend
19%,withmostlikelyrisebeing20%
AverageDeclineinDowntrend
17%,withmostlikelydeclinebeing15%
VolumeTrend
downward
Pullbacks
20%
Throwbacks
10%
Percentagemeetingpredictedpricetargetinuptrend
63%
Percentagemeetingpredictedpricetargetindowntrend
61%
Seealso
RectangleBottoms;RectangleTops
Pennants
Appearance
Ashortslopingtriangleboundedbytwoconvergingtrendlines
ReversalOrConsolidation
Short-term(upto3months)consolidation
FailureRateinUptrend
19%
FailureRateinDonwtrend
34%
AverageRiseinUptrend
21%,withmostlikelyrisebetween15%and20%
AverageDeclineinDowntrend
17%,withmostlikelydeclinebeing25%
VolumeTrend
downward
Pullbacks
17%
Throwbacks
16%
Percentagemeetingpredictedpricetargetinuptrend
58%
Percentagemeetingpredictedpricetargetindowntrend
52%
Seealso
Triangles,SymmetricalBottoms;Triangles,SymmetricalTops;Wedges,Falling;Wedges,Rising
Flagsandpennantslookalikeandinmanywaystheirperformanceissimilar,too.Theformationsareusuallyveryshortinduration,fromafewdaysto3weeks,andmarkthehalfwaypointinaquickpricemove.Theseformationscanbeprofitableshort-terminvestments,butyoumustbenimbleandattentivetotakefulladvantageofthem.Pennants,withafailurerateof34%indowntrends,areabovethe20%rateIconsideracceptable.Flagsat12%to13%andpennantsinauptrend(19%)performbetter.
旗形和三角旗形外观类似,性能也类似。
它们周期相当短,1天到三周,是快速价格运动的中继。
短期操作可以获利,但是三角旗形在下跌趋势中失败率相当高,34%。
Thepercentageofformationsthatmeetorexceedtheirpredictedpricetargetsisdisappointingforbothflagsandpennants.Iviewvaluesabove80%tobereliable,buttheresultsshowvaluesthatrangefrom52%to63%,suggestingthatyoushouldtradetheseformationswithcautionasyourprofitsmaynotbeaslargeasyouexpect.
目标价格达成率非常让人失望,所以不可奢望太高收益。
Themostlikelyriseordeclineisdeceptivefortheseformations.Whenthelikelyriseordeclinevalueisabovetheaverage,itsimplymeansthatafrequencydistributionshowsmorehitsataparticularvalue,butthebintotalsofthepriorcolumnsarehigh,pullingtheaveragedownward.
Tour
Figure14.1showsagoodexampleofaflag.Itisboundedbytwoparalleltrendlinesandusuallyislessthan3weekslong(sometimesasshortasafewdays).Youseetheseformationsappearinginstronguptrendsordowntrends(suchasthatshowninFigure14.1),usuallynearthehalfwaypointinthemove.Thisparticularflaggoesagainstthegraininthesensethatpricesriseinadowntrend.Thisisthemostcommonbehavior—aretraceinadowntrend—butitisnotunusualforflagstoappearhorizontal(asshortrectangles)orslopedownward(followingthetrend).Sinceflagscanalsoappearinanuptrend,theyusuallyslopedownward,butcanbehorizontalorslopeupwardtoo.
旗形是两条平行的趋势线,它们可能倾斜向任何方向,也可能水平。
Thevolumetrendisdownward.AsweseeintheStatisticssectionofthischapter,arecedingvolumetrendusuallyaccompaniesflagformations.Figure14.2showswhatapennantlookslike.Theonlyvisualdifferencebetweenaflagandapennantistheshapeoftheformation.Twoslopingtrendlinesthateventuallymeetoutlineapennantformation,resemblingasmallwedge.Sometimesthetrendlinesslopeupward,asinFigure14.2,andsometimestheydonot.Usually,theyslopeupwardinadowntrendanddownwardinanuptrend.Liketheflagformation,thevolumepatternrecedes.Forpennants,therecedingvolumetrendismoreprevalent,occurringinnearlyalltheformationsinthisstudy.
成交量是下降趋势的。
IdentificationGuidelines
Table14.1outlinestheidentificationcharacteristicsforflagsandpennants.TwoparalleltrendlinesbounddiepriceactionforflagsasshowninFigure14.3.TwoconvergingtrendlinesoutlinetheboundariesforpennantsasshowninFigure14.4.Inbothfiguresdieformationsareshortcomparedwithmanyotherchartpatternsinthisbook.IndiecaseofFigure14.3,theformationis12tradingdayslong,whereasthepennantinFigure14.4isjust8tradingdayslong.Manytimeswhenaformationisveryshort,suchas3or4days,itappearsasahorizontalrectangle—adarkblobindiemiddleofafastpricetrend.Theformationsusuallyareshorterthan3weeksbutthisisanarbitrarylimit.Sixteenformationsinthisstudy(6%)havedurationsgreaterthan3weeks(thelongestflagis32daysandthelongestpennantis28days).
旗形持续时间短!
Reliableflagsandpennantsappearduringsteep,quickpricetrends.Thetrendsmightbeupordown,butpricesriseorfallquickly,movingseveralpointsinjustafewdaystoafewweeks.InFigure14.3,forexample,thedowntrendbeginsonJanuary18andtheflagbeginsonFebruary1.Inthatshorttime,pricestumblefromahighof403/4toalowof301/8.AlthoughonemightarguetheuptrendinFigure14.4beginsinearlyApril,Isuggesttheriseleadingtothepennantbeginslater,onApril26,fromalowpriceof223/8.Sixtradingdayslater,thepriceclimbstothetopofthepennantat313/4.Thelaterstartingpointisafterthetwominorhighsanditservesasareferencepointforthemeasurerule.
旗形出现在快速的价格移动中比较可靠!
Figure14.3,thepricetrendindieflagslopesupward,whereasinFigure14.4thepennantslopesdownward.Thisbehavioristypicalfortheprevailingpricetrend(thatis,flagsorpennantstypicallymoveagainstthetrend).Thechartpatternsusuallyappearnearthemidpointofthemove.Assuch,theyareoftentermedhalf-mastformations.
Thevolumetrendnearlyalwaysrecedesoverthecourseoftheformation.However,thisisnotaninviolaterulebutusuallyisthecase.Ishouldpointoutthatrisingvolumeisnocauseforalarm.Ofthe45formationfailures,only4haverisingvolumetrends.
Whenselectingaflagorpennanttotrade,themostimportantguidelineistherapid,steeppricetrend.Ifpricesaremeanderingupordownandformaflagorpennant,thenlookelsewhere.Theflagorpennantmustbeaplacewherethestockcantakeabreatherfromitsrapidpace.Pricesmoveagainsttheshort-termtrendforseveraldaysbeforecontinuingon.
FocusonFailures
Likeallformations,flagsandpennantsarenotimmunetofailure.Figure14.5showsaflagfailure.Theflag,whileobeyingtheconfinesofthetwodownslopingtrendlines,hasagoodvolumetrend.Pricesshouldcontinuehigheraftertheflagcompletesbutdonot.Why?
Oneexplanationisthattheformationisjusttoolongat26days.Sometimesanexcessivelylongformationsuggestsanimpendingfailureoraweakpricemove(afterthebreakout).Tradeflagsorpennantsmorethan3weekslongcarefullyorpassthemupentirely.
图14.5中旗形,拥有两条下降的平行趋势线,有很好的成交量走势,为什么价格没能继续上涨?
一种解释是形态持续时间太长。
Figure14.6,anotherflagformation,isalsoafailure.Pricesshouldcontinuerisingaftertheflagcompletes.Thedurationisgood,at10days(aboutaverageforflags),andthevolumetrendisdownward.However,theformationhasaninadequatepriceriseleadingtoit.Thedifferencebetweenthetake-offpointandtheformationhighisjustoveradollar,wellshortofthe19%averagerise.Thereisprobablylittledangerthatyouwouldselectthisformationtotrade.Sinceflagsandpennantssignalthehalfwaypoint,thepredictedriseinthisexampleisjusttoosmalltotakeadvantageof.Aninvestorviewingthisformationfortradingwouldlikelypassitby.
图14.6是另一种失败的例子,它的问题在于前期的价格走势太弱。
出现在强势的价格走势中的旗形才比较可靠。
Figure14.7showsafailureofapennantinadowntrend.Theformationprobablyremindsyouofashortsymmetricaltriangle—onethatactsasareversal(whichisunusualforasymmetricaltriangle).Thevolumetrendisreceding,asyouwouldexpect.Theformationpricetrend,boundedbythetwoslopingtrendlines,looksgoodtoo.Thepricetrendleadingdowntotheformationrepresentsan18%decline,exactlytheaverageforapennantinadowntrend.Pricesshouldcontinuemovinglowerafterthisformationcompletesbuttheydonot.Why?
YoucanseeinFigure14.7thatpriceslooparoundtheformationendthenheadlower(athrowback).Ifyouheldontoyourshortposition,youwouldeventuallymakemoney.However,Istillclassifythisformationasafailure.Pricesshouldcontinuedownimmediatelyafterpiercingthetrendlineboundary.Thereasonpricesascendimmediatelyisnotclear.Ascanofthedatabasereveals66%oftheformationfailures(30outof45)failinthismanner.Thatistosay,theymovebrieflyinthewrongdirection(abreakoutfailure)butsoonturnaround(bythrowbackorpullback)andcompleteproperly.
旗形的失败案例66%是图14.7的情况,价格向上突破,然后掉头下跌。
虽然最终还是下跌了,但是突破方向反了。
TradingTactics
Table14.5showstradingtacticsforflagsandpennants.ConsultFigure14.8asIreviewthetacticslistedinTable14.5.Themeasurerulegaugestheminimumpricemove.Itisthesameforbothflagsandpennants.First,determinewherethetrendbegins,whichisusuallytheminorhigh(fordowntrends)orlow(foruptrends)precedingtheformation.Figure14.8showsthetrendbeginningatpointA.Subtractthelowattheformationstart(pointBat423/4)frompointA(47'/z),givingadifferenceof43/4.Subtractthedifferencefromthehighattheformationend(pointCat43)togivethetargetpriceof381/4.Pricesreachthetarget13tradingdaysaftertheymovebelowtheformationtrendline.Whentradingflagsandpennants,youmustfirstbesureyouhaveavalidformation.UsetheidentificationguidelinesoutlinedinTable14.1toensurethatyouhave
 升级会员
升级会员 