财务报表分析与运用杰拉尔德课后答案英文版第三章.docx
《财务报表分析与运用杰拉尔德课后答案英文版第三章.docx》由会员分享,可在线阅读,更多相关《财务报表分析与运用杰拉尔德课后答案英文版第三章.docx(50页珍藏版)》请在冰豆网上搜索。
财务报表分析与运用杰拉尔德课后答案英文版第三章
财务报表分析与运用杰拉尔德课后答案英文版第三章
Chapter3-Solutions
Overview:
ProblemLengthProblem#’s
{S}1,3
{M}2,7,8,12,13
{L}4-6,9-11,14,15
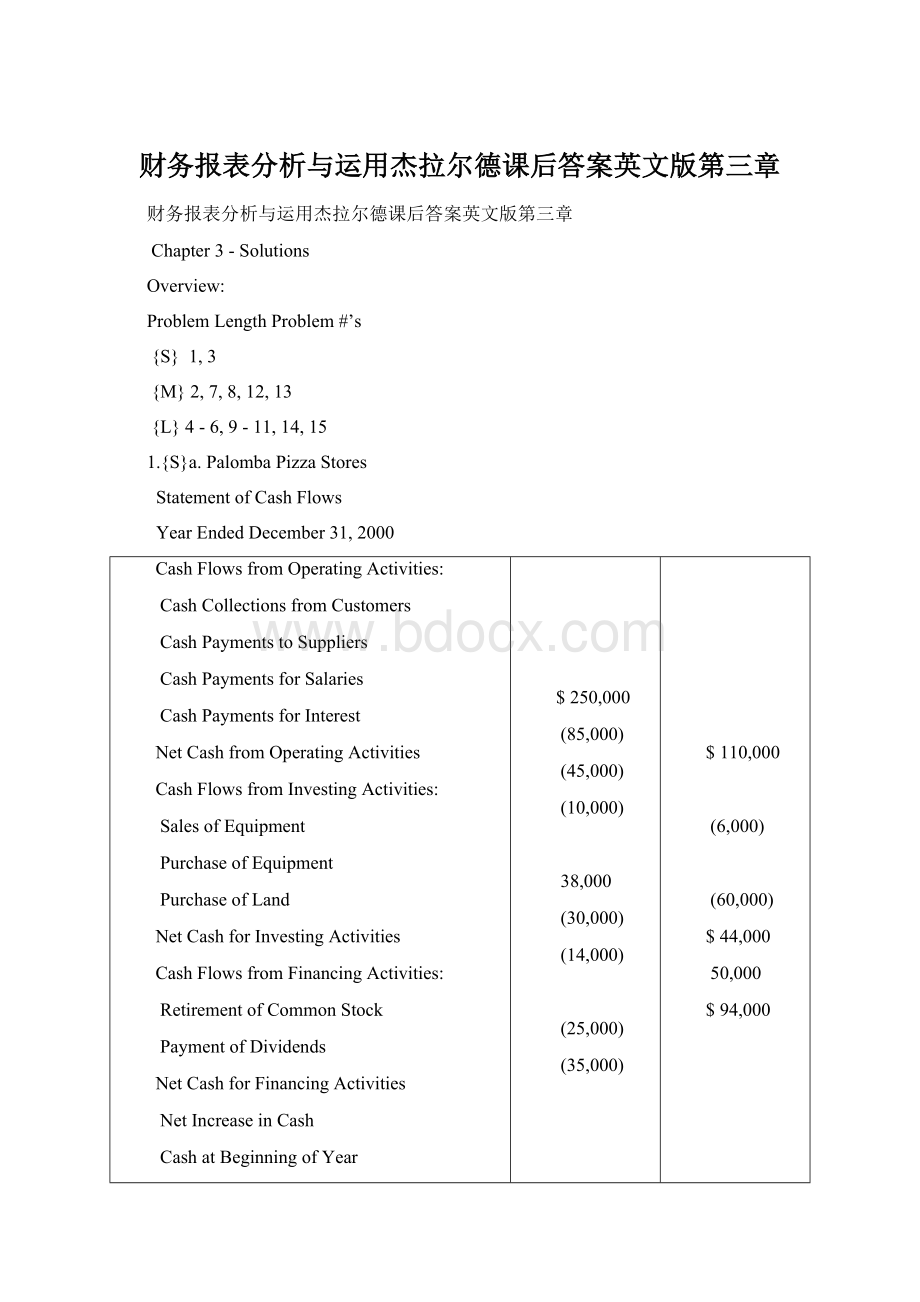
1.{S}a.PalombaPizzaStores
StatementofCashFlows
YearEndedDecember31,2000
CashFlowsfromOperatingActivities:
CashCollectionsfromCustomers
CashPaymentstoSuppliers
CashPaymentsforSalaries
CashPaymentsforInterest
NetCashfromOperatingActivities
CashFlowsfromInvestingActivities:
SalesofEquipment
PurchaseofEquipment
PurchaseofLand
NetCashforInvestingActivities
CashFlowsfromFinancingActivities:
RetirementofCommonStock
PaymentofDividends
NetCashforFinancingActivities
NetIncreaseinCash
CashatBeginningofYear
CashatEndofYear
$250,000
(85,000)
(45,000)
(10,000)
38,000
(30,000)
(14,000)
(25,000)
(35,000)
$110,000
(6,000)
(60,000)
$44,000
50,000
$94,000
b.CashFlowfromOperations(CFO)measuresthecashgeneratingabilityofoperations,inadditiontoprofitability.Ifusedasameasureofperformance,CFOislesssubjecttodistortionthannetincome.AnalystsusetheCFOasacheckonthequalityofreportedearnings,althoughitisnotasubstitutefornetincome.CompanieswithhighnetincomeandlowCFOmaybeusingoverlyaggressiveincomerecognitiontechniques.Theabilityofafirmtogeneratecashfromoperationsonaconsistentbasisisoneindicationofthefinancialhealthofthefirm.AnalystssearchfortrendsinCFOtoindicatefuturecashconditionsandpotentialliquidityorsolvencyproblems.
CashFlowfromInvestingActivities(CFI)reportshowthefirmisinvestingitsexcesscash.TheanalystmustconsidertheabilityofthefirmtocontinuetogrowandCFIisagoodindicationoftheattitudeofmanagementinthisarea.Thiscomponentoftotalcashflowincludesthecapitalexpendituresmadebymanagementtomaintainandexpandproductivecapacity.DecreasingCFImaybeaforecastofslowerfuturegrowth.
CashFlowfromFinancing(CFF)indicatesthesourcesoffinancingforthefirm.Forfirmsthatrequireexternalsourcesoffinancing(eitherborrowingorequityfinancing)itcommunicatesmanagement'spreferencesregardingfinancialleverage.Debtfinancingindicatesfuturecashrequirementsforprincipalandinterestpayments.Equityfinancingwillcausefutureearningspersharedilution.
Forfirmswhoseoperatingcashflowexceedsinvestmentneeds,CFFindicateswhetherthatexcessisusedtorepaydebt,pay(orincrease)cashdividends,orrepurchaseoutstandingshares.
c.CashpaymentsforinterestshouldbeclassifiedasCFFforpurposesofanalysis.Thisclassificationseparatestheeffectoffinancialleveragedecisionsfromoperatingresults.ItalsofacilitatesthecomparisonofPalombawithotherfirmswhosefinancialleveragediffers.
d.Thechangeincashhasnoanalyticsignificance.Thechangeincash(andhence,thecashbalanceattheendoftheyear)isaproductofmanagementdecisionsregardingfinancing.Forexample,thefirmcanshowalargecashbalancebydrawingonbanklinesjustpriortoyearend.
e.andf.
Thereareanumberofdefinitionsoffreecashflows.
Inthetext,freecashflowisdefinedascashfromoperationslesstheamountofcapitalexpendituresrequiredtomaintainthefirm’scurrentproductivecapacity.Thisdefinitionrequirestheexclusionofcostsofgrowthandacquisitions.However,fewfirmsprovideseparatedisclosuresofexpendituresincurredtomaintainproductivecapacity.Capitalcostsofacquisitionsmaybeobtainedfromproxystatementsandotherdisclosuresofacquisitions(SeeChapter14).
Inthefinanceliterature,freecashflowsavailabletoequityholdersareoftenmeasuredascashfromoperationslesscapitalexpenditures.Interestpaidisadeductionwhencomputingcashfromoperationsasitispaidtocreditors.Palomba’sfreecashflowavailabletoequityholdersiscalculatedasfollows:
Netcashflowfromoperatingactivitieslessnetcashforinvestingactivities:
$110,000-$6,000=$104,000
Theinvestmentactivitiesdisclosedintheproblemdonotindicateanyacquisitions.
Anotherdefinitionoffreecashflows,whichfocusesonfreecashflowavailabletoallprovidersofcapital,wouldexcludepaymentsforinterest($10,000inthiscase)anddebt.Thus,Palomba’sfreecashflowavailabletoallprovidersofcapitalwouldbe$114,000.
2.{M}a.
1996
1997
1998
1999
2000
2001
Sales
Baddebtexpense
Netreceivables
Cashcollections1
$---
---
30
$---
$140
7
40
$123
$150
7
50
$133
$165
8
60
$147
$175
10
75
$150
$195
10
95
$165
1Sales-baddebtexpense-increaseinnetreceivables
b.
1997
1998
1999
2000
2001
Baddebtexpense/sales
5.0%
4.7%
4.9%
5.7%
5.1%
Netreceivables/sales
28.6
33.3
36.4
42.8
48.7
Cashcollections/sales
87.9
88.7
89.1
85.7
84.6
c.Thebaddebtprovisiondoesnotseemtobeadequate.From1997-2001salesincreasedbyapproximately40%,whilenetreceivablesmorethandoubled,indicatingthatcollectionshavebeenlagging.Theratioscalculatedinpartbalsoindicatetheproblem.Whilebaddebtexpensehasremainedfairlyconstantat5%ofsalesoverthe5yearperiod,netreceivablesasapercentageofsaleshaveincreasedfrom29%to49%;cashcollectionsrelativetosaleshavedeclined.OtherpossibleexplanationsforthesedataarethatstatedpaymenttermshavelengthenedorthatStengelhasallowedcustomerstodelaypaymentforcompetitivereasons.
3.{S}NiagaraCompany
StatementofCashFlows2001
Cashcollections
Cashinputs
Cashexpenses
Cashinterestpaid
Incometaxespaid
CashfromOperations
Purchaseoffixedassets
CashUsedforInvesting
IncreaseinLTdebt
Decreaseinnotespayable
Dividendspaid
CashUsedforFinancing
NetChangeinCash
CashBalance12/31/00
CashBalance12/31/01
$980
(670)
(75)
(40)
(30)
$165
(150)
(150)
50
(25)
(30)
(5)
$1050
$60
[Sales-∆AccountsReceivable]
[COGS+∆Inventory
[Selling&GeneralExpense-∆AccountsPayable1]
[InterestExpense-∆InterestPayable]
[IncomeTaxExpense-∆DeferredTax]
[DepreciationExpense+∆FixedAssets(net)]
[NetIncome-∆Retainedearnings]
1Canalsobeusedtocalculatecashinputs,decreasingthatoutflowto$645whileincreasingcashexpensesto$100.
4.{L}a.GCompany
IncomeStatement,2000($thousands)
Sales
COGS+operating
expenses1
Depreciation
Interest
Taxes
Netincome
$3,841
3,651
15
41
42
$92
[receiptsfromcustomers+increaseinaccountsreceivable]
[payments-increaseininventory+increaseinaccountspayable]
[increaseinaccumulateddepreciation]
[payments]
[payment+increaseintaxpayable]
[check=changeinretainedearningsastherearenodividends]
1Notethatthesetwoitemscannotbecalculatedseparatelyfromtheinformationavailable.
b.MCompany
CashReceiptsandDisbursements,2000($thousands)
Cashreceiptsfrom:
Customers
Issueofstock
Short-termdebt
Long-termdebt
Total
Cashdisbursements:
COGSandoperatingexpenses
Taxes
Interest
Dividends
PP&Epurchase
Total
Changeincash
$1,807
3
62
96
$1,968
$1,843
3
51
22
33
$1,952
$16
[Sales-increaseinreceivables]
[Increaseinaccount]
[Increaseinliability]
[Increaseinliability]
[COGS+operatingexpense+increaseininventory+decreaseinaccountspayable]
[Expense-increaseintaxpayable]
[Expense]
[Income+increaseinretainedearnings]
[ChangeinPP&E]
Note:
Thisisnotatruereceiptsanddisbursementsscheduleasitshowscertainamounts(e.g.,debt)onanetbasisratherthangross.Suchschedules(andcashflowstatements)preparedfrompublisheddatacanonlyshowsomeamountsnet,unlesssupplementarydataareavailable.
c.ThecashflowstatementsarepresentedwiththeincomestatementforcomparisonpurposesinansweringPartd.
MCompany:
StatementofCashFlows($thousands)
1996
1997
1998
1999
2000
CFO:
Fromcustomers
Lessoutlaysfor:
COGS/oper.exp.
Interest
Taxes
CFI:
PP&Epurchase
CFF:
Issueofstock
Short-termdebt
Long-termdebt
Dividends
Stockrepurchase
LTdebtrepaid
STdebtrepaid
Changeincash
$1,165
1,130
15
23
$(3)
(14)
5
64
--
(20)
(22)
(2)
--
$25
8
$1,210
1,187
19
19
$(15)
(17)
5
65
--
(21)
(14)
(2)
--
$33
1
$1,327
1,326
16
9
$(24)
(37)
8
--
100
(21)
--
(3)
(8)
$76
15
$1,587
1,672
21
9
$(115)
(30)
3
153
--
(21)
(10)
--
--
$125
(20)
$1,807
1,843
51
3
$(90)
(33)
3
62
96
(22)
--
--
--
$139
16
MCompany:
IncomeStatement($thousands)
1996
1997
1998
1999
2000
Sales
COGS
Operatingexpense
Depreciation
Interest
Taxes
Total
NetIncome
$1,220
818
298
9
15
38
$1,178
42
$1,265
843
320
10
19
33
$1,225
40
$1,384
931
363
11
16
27
$1,348
36
$1,655
1,125
434
12
21
26
$1,852
37
$1,861
1,277
504
14
51
6
$1,852
9
GCompany:
StatementofCashFlows($thousands)
1996
1997
1998
1999
2000
CFO:
Fromcustomers
Disbursements:
COGS/Oper.exp.
Interest
Taxes
CFI:
PP&Epurchase
CFF:
Issueofstock
Short-termdebt
Long-termdebt
Changeincash
$1,110
1,214
11
13
$(128)
---
10
80
40
$130
$2
$1,659
1,702
13
15
$(71)
---
---
52
23
$75
$4
$2,163
1,702
23
16
$(
 升级会员
升级会员 