X-R统计控制图的使用方法.pptx
《X-R统计控制图的使用方法.pptx》由会员分享,可在线阅读,更多相关《X-R统计控制图的使用方法.pptx(12页珍藏版)》请在冰豆网上搜索。

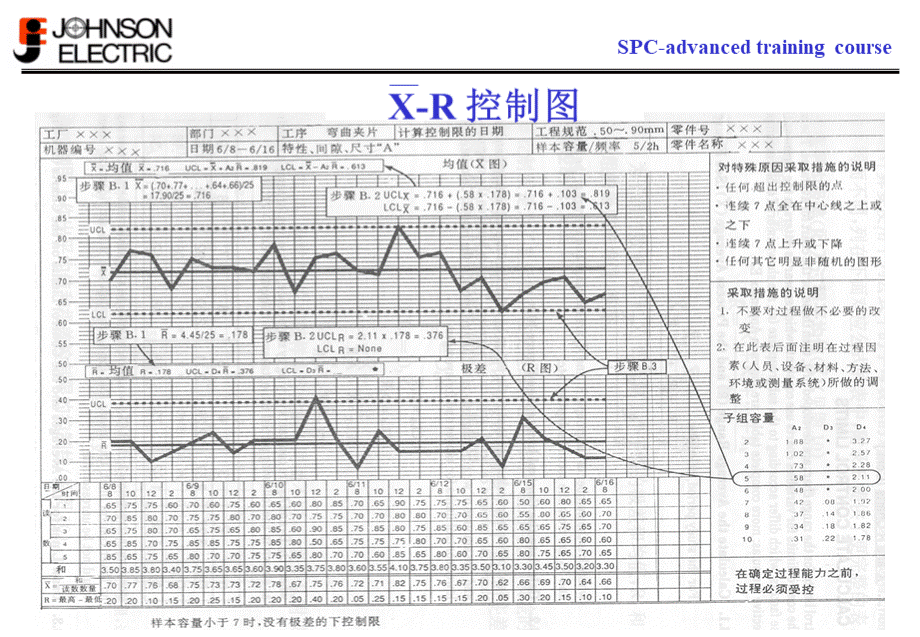
X-R控制图,過程控制,a)計算及繪畫控制限-樣本容量低於7時,極差並沒有LCL,解释控制图,Changeinlevel,Changeinvariability,解釋控制圖,-確定是否有不受控的情況-檢查過程記錄,找出並列明任何特殊原因。
-再計算控制限。
控制上限,(UCL),中線,控制下限,(LCL),控制上限,(UCL),中線,控制下限,(LCL),受控過程,不受擯過程,Test1.OnePointBeyondZoneA,Test2.NinePointsinaRowonOneSideoftheCenterLine,Test3.SixPointsinaRowSteadilyIncreasingorDecreasing,Test4.FourteenPointsinaRowAlternatingUpandDown,x,x,x,x,x,x,控制图失控检验,Test5.TwoOutofThreePointsinaRowinZoneAorBeyond,Test6.FourOutofFivePointsinaRowinZoneBandBeyond,Test7.FifteenPointsinaRowinZoneC(AboveandBelowCenterline),Test8.EightPointsinaRowonBothSidesofCenterlinewithNoneinZoneC,x,x,x,x,x,x,x,控制图的失控检验,控制图失控检验,OnepointaboveUCL,Twooutofthreesuccessivepointhereorabove,Fouroutoffivesuccessivepointhereorabove,Sevenoutofeightsuccessivepointhereorabove,OnepointaboveLCL,Twooutofthreesuccessivepointhereorbellow,Fouroutoffivesuccessivepointhereorbellow,Sevenoutofeightsuccessivepointhereorbellow,3s,2s,1s,-3s,-2s,-1s,0,34.1%,13.6%,34.1%,13.6%,2.2%,2.2%,0.1%,0.1%,SeasonalTrends:
Thesecouldbecausedbysystematicchangeslike:
temperature,operatorfatigue,voltageorpressurefluctuations,etc.,Mixtures:
Aclearindicationiswhenmostofthepointsareclosetothecontrollimits,andalmostnopointsnearthecenterline.Theseareusuallyduetounderestimatingtheprocessvariabilityor“over-control”,whereoperatorsintervenewiththeprocessfrequentlytryingtorespondtoinherentvariabilityinsteadofassignablecauses.Thisalsooccurswhencontrollingtwoprocessesonthesamechart.,控制图的趋势判断规则,Changesinprocessmeans:
Theseareusuallyduetotheintroductionofnewoperators,machines,procedures,etc.Canalsohappenbecauseofprocessimprovements.,Upward/DownwardTrends:
Continuoustrendingonthesamedirection.Theseareusuallycausedbycomponentwearamongothers.,控制图的趋势判断规则,“WhiteSpace”:
Pointstendtoclusteraroundthemean.Usuallycausedby:
(1)incorrectcontrollimits(overestimatingprocessvariability),
(2)continuousimprovementspaying-off.Limitsshouldberecalculatedwhenthissituationisfound.,控制图的趋势判断规则,製程控制,對特殊原因採取的措施1.即時分析失控情況是非常重要的,以便將不符合規格的產品減至最少;並取得新的數據作調查分析。
2.特殊原因可以是正面或負面3.在控制圖中,我們可能會在任何單值子組中得到一個特殊原因的錯誤信息。
ExampleofOCAPinW7PT,