雅思考试小作文总结docx.docx
《雅思考试小作文总结docx.docx》由会员分享,可在线阅读,更多相关《雅思考试小作文总结docx.docx(13页珍藏版)》请在冰豆网上搜索。
雅思考试小作文总结docx
2014年雅思小作文汇总
1.9
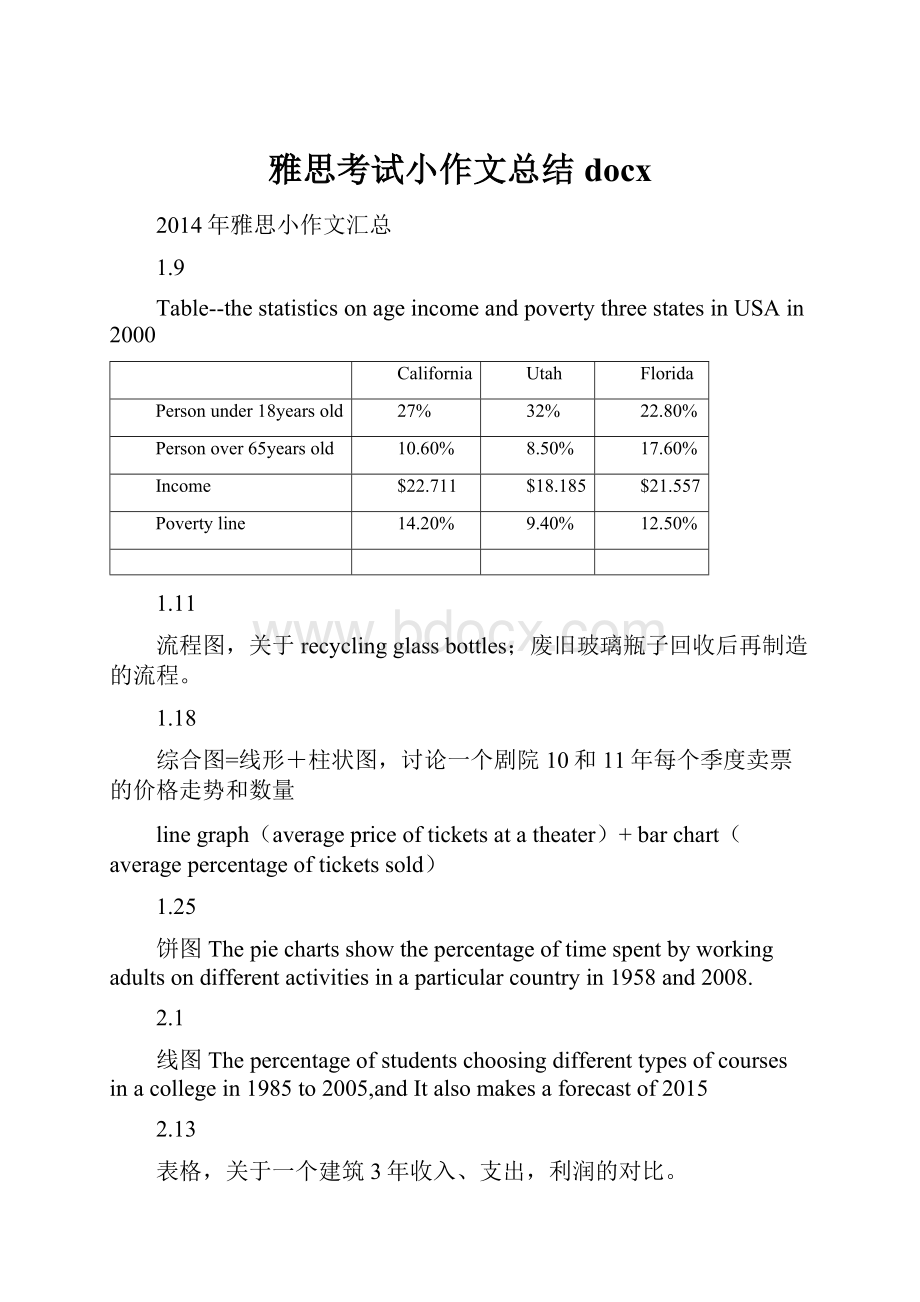
Table--thestatisticsonageincomeandpovertythreestatesinUSAin2000
California
Utah
Florida
Personunder18yearsold
27%
32%
22.80%
Personover65yearsold
10.60%
8.50%
17.60%
Income
$22.711
$18.185
$21.557
Povertyline
14.20%
9.40%
12.50%
1.11
流程图,关于recycling glass bottles;废旧玻璃瓶子回收后再制造的流程。
1.18
综合图=线形+柱状图,讨论一个剧院10和11年每个季度卖票的价格走势和数量
linegraph(averagepriceofticketsatatheater)+barchart(averagepercentageofticketssold)
1.25
饼图Thepiechartsshowthepercentageoftimespentbyworkingadultsondifferentactivitiesinaparticularcountryin1958and2008.
2.1
线图Thepercentageofstudentschoosingdifferenttypesofcoursesinacollegein1985to2005,andItalsomakesaforecastof2015
2.13
表格,关于一个建筑3年收入、支出,利润的对比。
2.15
线图,四个国家水质十年内对比
2.22
表格马来西亚和澳大利亚1980-2002的人口数据比较。
3.1
地图:
关于学校现在和15年前的规划布局对比
3.8
流程图-题目是描述三种recruitment method
3.13
柱图,关于四个国家之间垃圾处理的比较,包括:
burnt,recycled,landfill。
3.15
柱图,关于世界各地的小麦产量.Asia\Europe\therestofworld,shareofworldproductionsbetween1840and2000.
4.5
线图Linechart:
governmentspendingonretirementpensions,educationandhealthfrom2001andprojectedto2051(图类剑桥5-p29将来时)
4.12
线图-四条线,关于运输的
4.24
柱状图
4.26
twobarcharts,比较1996-2006某欧洲国家percentageoffilmsrealised,和percentageofcinematicketssold。
四种filmtypes分别drama,comedy,fantasy和romance
5.10
FlowChartonHowtomakesoftcheese
5.15
柱图,关于两种气候的雨水和温度变化
5.17
地图
5.24
表格,3个年份5种锻炼方式比较
6.7
柱图,关于六个发达国家对发展中国家aid的投入
6.19
柱状图
ThegraphbelowshowsthenumberofoverseavisitorswhocametotheUKfordifferentpurposesbetween1989to2009
6.21
地图题,一个公园10年前后的变化
6.28
柱图,lifeexpectancy,4个国家2008年后出生人寿命预估,1980或1983到2002寿命增长
7.10
流程图,沙漠的hill怎么形成的
7.12
表线组合,饼图
7.19
流程图,processofoldbatteriesturningtonewbatteriesandusefulproducts;
7.26
表格:
Thetableshowsthetotallengthofhighspeedtraintracksinthreecountriesin1990、2010andthepredictionfor2020.
8.2
2个barchart,GermanyUSAJapanChina在agricultureindustry&services的worker比例.
8.9
表格题,竖四横三。
2001和2006年AUS三个地方的住宅类型(+other)所占的比例
澳大利亚三个地方的住所偏好比较
8.16
地图题:
fireescapeplanonsecondfloorofstudentaccommodationatacollege(有两个exitdoor七个bedroom)
8.21
柱图,98年和08年欧洲人某些commodities消费的升降
9.4
柱图
9.6
柱表组合图
9.20
地图,条河两侧建筑在1980年和现在变化的对比。
9.27
表格题:
三个国家在2003,2006,2009生产汽车的数量。
10.2
柱状图
10.11
表格,对比04年澳洲五个城市的用水费用。
10.18
流程图,8个stages写smokedfish的制作过程;
10.25
地图
11.1
两个柱状图。
第一个比较AustraliaandChina的进口与出口。
第二个澳大利亚从中国进口的货物。
11.8
柱图Thebarchartbelowshowsinformationaboutreasonswhymenandwomenmakeatripin
11.13
地图题
11.22
表格,关于美国和加拿大留学生的对比
12.4
linegraph
Thelinegraphcompareshowmuchtimeitwouldtakeforthreecompaniestomanufactureacar.
12.6
Linegraph
Thelinegraphillustratesattendanceoftop—leagueintheUK,GermanyandItalyfrom1980to2004
12.13
表格
12.20
Piecharts
2015年雅思小作文汇总
1.10
柱状图
ThebarchartbelowshowspercentageofadultsofdifferentagegroupsintheUKwhousedtheinterneteverydayfrom2003-2006.
1.17
线图
Thelinegraphshowsthesalesofchildren'sbooks,adult'sfictionsandeducationalbooksbetween2002and2006inonecountry.
1.29
流程图
Thediagramdescribestheproductionofcannedfruit.
1.31
柱状图
Thechartbelowshowsthepercentageofthewholeworldpopulationinfourcountriesfrom1950-2002,withprojectionsto2050.
2.7
混合图
Thetableandchartshowthetimespentatleisureandhouseholdactivitiesin2008.
2.12
表格
Thetablebelowshowsthepercentageof“verygood”ratedbyfirst-yearstudents.
2.14
流程图
Thediagrambelowillustrateshowasimplewaterfilterisconstructedandhowitfunctionstoproducedeandrinkingwater.
2.28
柱状图
ThechartbelowshowstheexpenditureonthreecategorieswithdifferentproportionsamongresidentsintheUKin2004
3.12
表格
Thetabledescribesthechangeofpeoplewhowentforinternationaltravelin1990,1995,2000,and2005(million)
3.14
Barchart
Thebarchartsdescribethematerialsthatrequiredtomaketwodifferenttypesofcups,andthepercentageofmaterialtomakeeverycup.
3.21.
地图显示某大学校园变迁
3.28
Bar
四个柱图比较四个国家(丹麦、瑞典、英国、法国)工人工作时间百分百。
4.11
Line+Bar
4.18
Table
4.25
Barchart
ThechartshowsthemostcommonlyusedplacestogetaccesstotheInternet
4.30
地图
Theplansbelowshowthechangesofaparticularareafrom1965topresentdaytheplansalsogiveadescriptionoftheproposedchangesinfuture.
5.9
Table
Thetableshowsthedifferenceof secondary/highschoolteachers' salaryinfivedifferentcountriesin2009.(starting,after15years,max,yearstakentothetop)
5.16
FlowChart
Thediagramshowsthestagesofprocessingcocoabeans.
5.21
BarChart
Thebarchartsshowthedifferentpercentageof boysandgirlsgettingtopgrades(AandB) inSciences,Arts,Maths,LanguageandHumanitiesinonecountry in1960and2000.
6.6
Map
6.13
混合(饼图+柱状图)
ThefirstchartsshowsinformationaboutconsumersofwaterinAustraliain2004.Thesecondchartshowshowresidentialwaterwasusedforthesameyear.
6.18
Table
ThetablegivesinformationaboutannualsalariesoffiveemploymentsectorsinAustraliain2006
6.27
Linegraph
ThetwolinegraphsshowthechangesoftravellersbytraininSydneyfrom1995to2004andtheproportionoftrainarrivingontime.
7.4
BarChart
Thebarchartshowschildren'sactivitieswithintwoweeksbetween5and14yearsoldinAustralia.
7.11
LineGraph
Thelinegraphshowsthenumbersofvisitorstomoutains,lakesandseashoresinEurope.
7.23
BarCharts
Thechartshowsthepercentageofunemployedpeopleagedbetween15and24infiveEuropeancountriesin2005,withtheoverallunemploymentin2005.
7.25
BarChart
Thebarchartshowsthenumbersofmagazinessoldperpersoninfivecountriesin2000and2010,withprojectedsalesin2020.
8.1
Map
Thetwomapsshowthetwopossiblelayoutsforaroom.
8.8
LineGraph
Thelinegraphshowsthedollars(perpersonpopulation)spentonresearchaboutrenewableenergyinfourcountriesfrom1975to2000.
8.13
BarCharts
Thebarchartsshowthetypesofbooksbetween1972and2012.
8.29
BarCharts
Thebarchartsshowthesourcesofenergyinacountryduringtwo-yearperiod.
9.3
Barchart
Thebarchartbelowshowstheinformationaboutthefavoritesubjectsof60studentsfromtwoschools,schoolAandschoolB
9.12
LineGraph
ThelinegraphshowsthethreedifferenttypesofcrimesinEnglandandWalesfrom1970to2005
9.19
LineGraph
Thelinegraphshowsthepercentageofpeopleusingpublictransportandpeopleusingprivatecarsinfivecountries.关于五个国家在公共交通和私家车使用率。
9.26
LineGraph
Thelinegraphshowsthepercentageofpeoplegoingtomovietheatredifferentagegroups.
10.8
TheplansbelowshowtheSouthWingofWaltonMuseumin2008andin2012afteritwasredeveloped.
10.10
PieChart
Thepiechartsshowtheuseofwaterbysecters(food,building,manufacturing,household,service)nSydneyfrom1997to2007.
10.24
LineGraph
10.31
LineGraph
Thelinegraphshowsthelandfororganiccrops.
11.7
A卷
Line Graph
ThelinegraphshowsthemarriageinUK.
B卷
BarChart
Thebarchartshowsthreekindsoffruitandtheamountexportedtodifferentcountiesin2012.
11.19
A卷
小作文
B卷
线图。
比较1987到2007四类鱼数量的变化
11.21
A卷:
五个不同国家三年向澳洲移民的动态,linechart
B卷:
柱状图,五个国家healthspendingGDP
12.03
地图题
Pentland小镇1950与2007年之间的对比图
12.05
流程图橄榄图的制作
12.12
混合图
ThetableandchartshowthenumberofUKcruisepassengersin1995and2003,andclassifythesepassengersaccordingtotheirages
12.19
Thebarchartsshowtheemploymentrateofmenandwomenagedbetween60and64indifferentcountriesin1991and2001.
 升级会员
升级会员 