单方程第5题ARIMA模型例59建立中国GDP对数序列的ARIMA模型.docx
《单方程第5题ARIMA模型例59建立中国GDP对数序列的ARIMA模型.docx》由会员分享,可在线阅读,更多相关《单方程第5题ARIMA模型例59建立中国GDP对数序列的ARIMA模型.docx(25页珍藏版)》请在冰豆网上搜索。
单方程第5题ARIMA模型例59建立中国GDP对数序列的ARIMA模型
5.ARIMA模型
第一步:
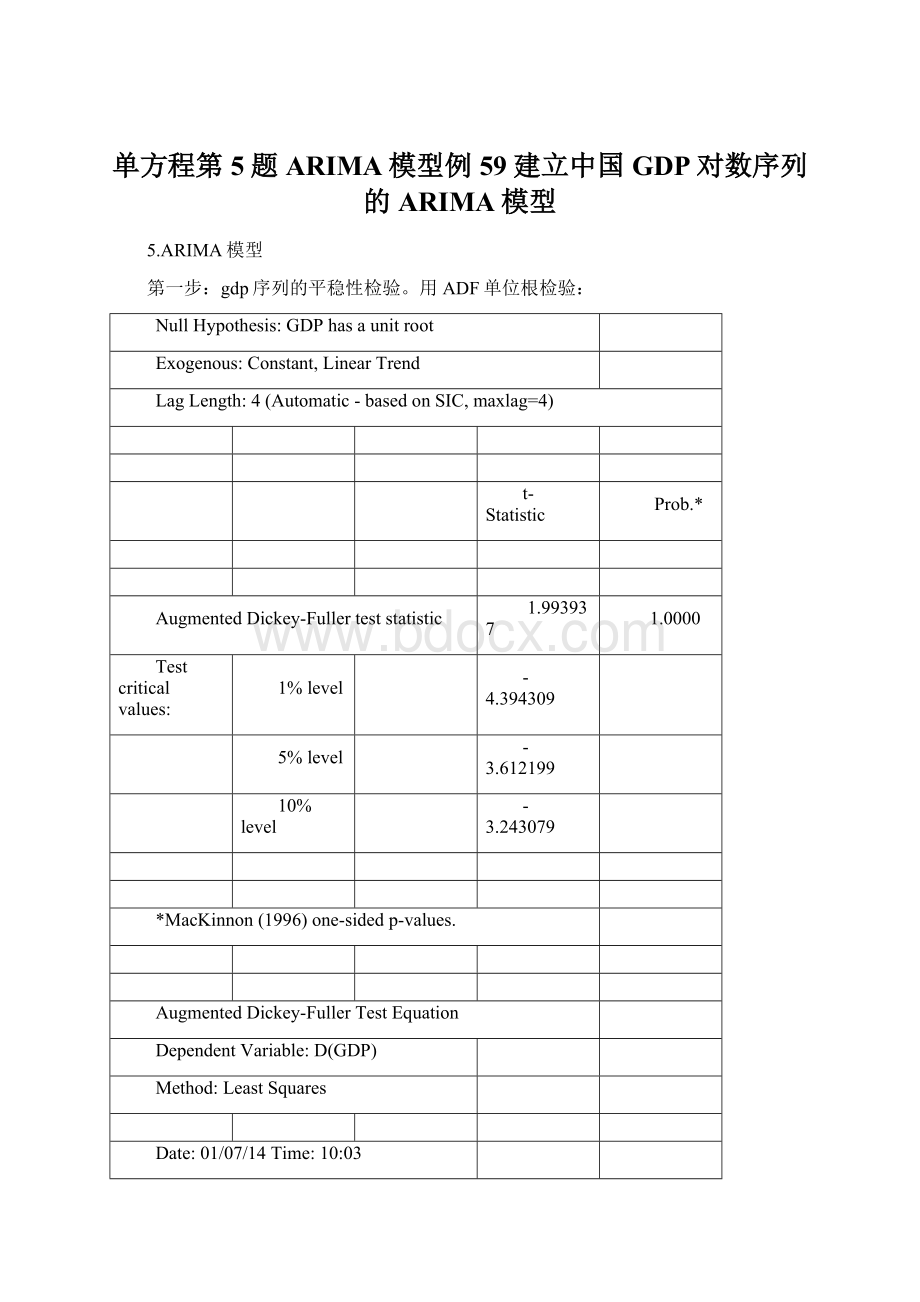
gdp序列的平稳性检验。
用ADF单位根检验:
NullHypothesis:
GDPhasaunitroot
Exogenous:
Constant,LinearTrend
LagLength:
4(Automatic-basedonSIC,maxlag=4)
t-Statistic
Prob.*
AugmentedDickey-Fullerteststatistic
1.993937
1.0000
Testcriticalvalues:
1%level
-4.394309
5%level
-3.612199
10%level
-3.243079
*MacKinnon(1996)one-sidedp-values.
AugmentedDickey-FullerTestEquation
DependentVariable:
D(GDP)
Method:
LeastSquares
Date:
01/07/14Time:
10:
03
Sample(adjusted):
19832006
Includedobservations:
24afteradjustments
Variable
Coefficient
Std.Error
t-Statistic
Prob.
GDP(-1)
0.069206
0.034708
1.993937
0.0625
D(GDP(-1))
1.078825
0.239934
4.496342
0.0003
D(GDP(-2))
-0.860946
0.406194
-2.119545
0.0491
D(GDP(-3))
0.728386
0.501847
1.451411
0.1649
D(GDP(-4))
-0.813788
0.350036
-2.324869
0.0327
C
-402.4700
1591.446
-0.252896
0.8034
@TREND(1980)
161.2485
214.6915
0.751071
0.4629
R-squared
0.944348
Meandependentvar
8564.483
AdjustedR-squared
0.924706
S.D.dependentvar
7687.518
S.E.ofregression
2109.437
Akaikeinfocriterion
18.38472
Sumsquaredresid
Schwarzcriterion
18.72832
Loglikelihood
-213.6167
Hannan-Quinncriter.
18.47588
F-statistic
48.07816
Durbin-Watsonstat
2.069518
Prob(F-statistic)
0.000000
gdp序列以最大的p值,即100%的显著性接受原假设,即存在单位根。
第二步检验gdp一阶差分的平稳性,结果如下:
NullHypothesis:
GDPhasaunitroot
Exogenous:
Constant,LinearTrend
LagLength:
4(Automatic-basedonSIC,maxlag=4)
t-Statistic
Prob.*
AugmentedDickey-Fullerteststatistic
1.993937
1.0000
Testcriticalvalues:
1%level
-4.394309
5%level
-3.612199
10%level
-3.243079
*MacKinnon(1996)one-sidedp-values.
AugmentedDickey-FullerTestEquation
DependentVariable:
D(GDP)
Method:
LeastSquares
Date:
01/07/14Time:
10:
03
Sample(adjusted):
19832006
Includedobservations:
24afteradjustments
Variable
Coefficient
Std.Error
t-Statistic
Prob.
GDP(-1)
0.069206
0.034708
1.993937
0.0625
D(GDP(-1))
1.078825
0.239934
4.496342
0.0003
D(GDP(-2))
-0.860946
0.406194
-2.119545
0.0491
D(GDP(-3))
0.728386
0.501847
1.451411
0.1649
D(GDP(-4))
-0.813788
0.350036
-2.324869
0.0327
C
-402.4700
1591.446
-0.252896
0.8034
@TREND(1980)
161.2485
214.6915
0.751071
0.4629
R-squared
0.944348
Meandependentvar
8564.483
AdjustedR-squared
0.924706
S.D.dependentvar
7687.518
S.E.ofregression
2109.437
Akaikeinfocriterion
18.38472
Sumsquaredresid
Schwarzcriterion
18.72832
Loglikelihood
-213.6167
Hannan-Quinncriter.
18.47588
F-statistic
48.07816
Durbin-Watsonstat
2.069518
Prob(F-statistic)
0.000000
在16.66%的显著性水平下接受原假设,存在单位根,序列非平稳
第三步:
检验gdp二阶差分的平稳性,选择无常数项,趋势项,滞后阶数为0,结果如下:
NullHypothesis:
D2GDPhasaunitroot
Exogenous:
Constant
LagLength:
0(Automatic-basedonSIC,maxlag=0)
t-Statistic
Prob.*
AugmentedDickey-Fullerteststatistic
-3.291626
0.0258
Testcriticalvalues:
1%level
-3.711457
5%level
-2.981038
10%level
-2.629906
*MacKinnon(1996)one-sidedp-values.
AugmentedDickey-FullerTestEquation
DependentVariable:
D(D2GDP)
Method:
LeastSquares
Date:
01/07/14Time:
10:
15
Sample(adjusted):
19812006
Includedobservations:
26afteradjustments
Variable
Coefficient
Std.Error
t-Statistic
Prob.
D2GDP(-1)
-0.633042
0.192319
-3.291626
0.0031
C
687.3110
496.7749
1.383546
0.1792
R-squared
0.311034
Meandependentvar
113.3808
AdjustedR-squared
0.282327
S.D.dependentvar
2799.855
S.E.ofregression
2371.914
Akaikeinfocriterion
18.45459
Sumsquaredresid
1.35E+08
Schwarzcriterion
18.55136
Loglikelihood
-237.9096
Hannan-Quinncriter.
18.48245
F-statistic
10.83480
Durbin-Watsonstat
1.868580
Prob(F-statistic)
0.003074
T统计值小于相关临界值故认为是没有单位根的,由上述结果可见gdp序列是二阶单整序列
第四步检验ln(gdp)稳定性
NullHypothesis:
LNGDPhasaunitroot
Exogenous:
Constant
LagLength:
4(Automatic-basedonSIC,maxlag=6)
t-Statistic
Prob.*
AugmentedDickey-Fullerteststatistic
-1.055147
0.7160
Testcriticalvalues:
1%level
-3.73
 升级会员
升级会员 