时间序列分析实验设计文档格式.docx
《时间序列分析实验设计文档格式.docx》由会员分享,可在线阅读,更多相关《时间序列分析实验设计文档格式.docx(12页珍藏版)》请在冰豆网上搜索。
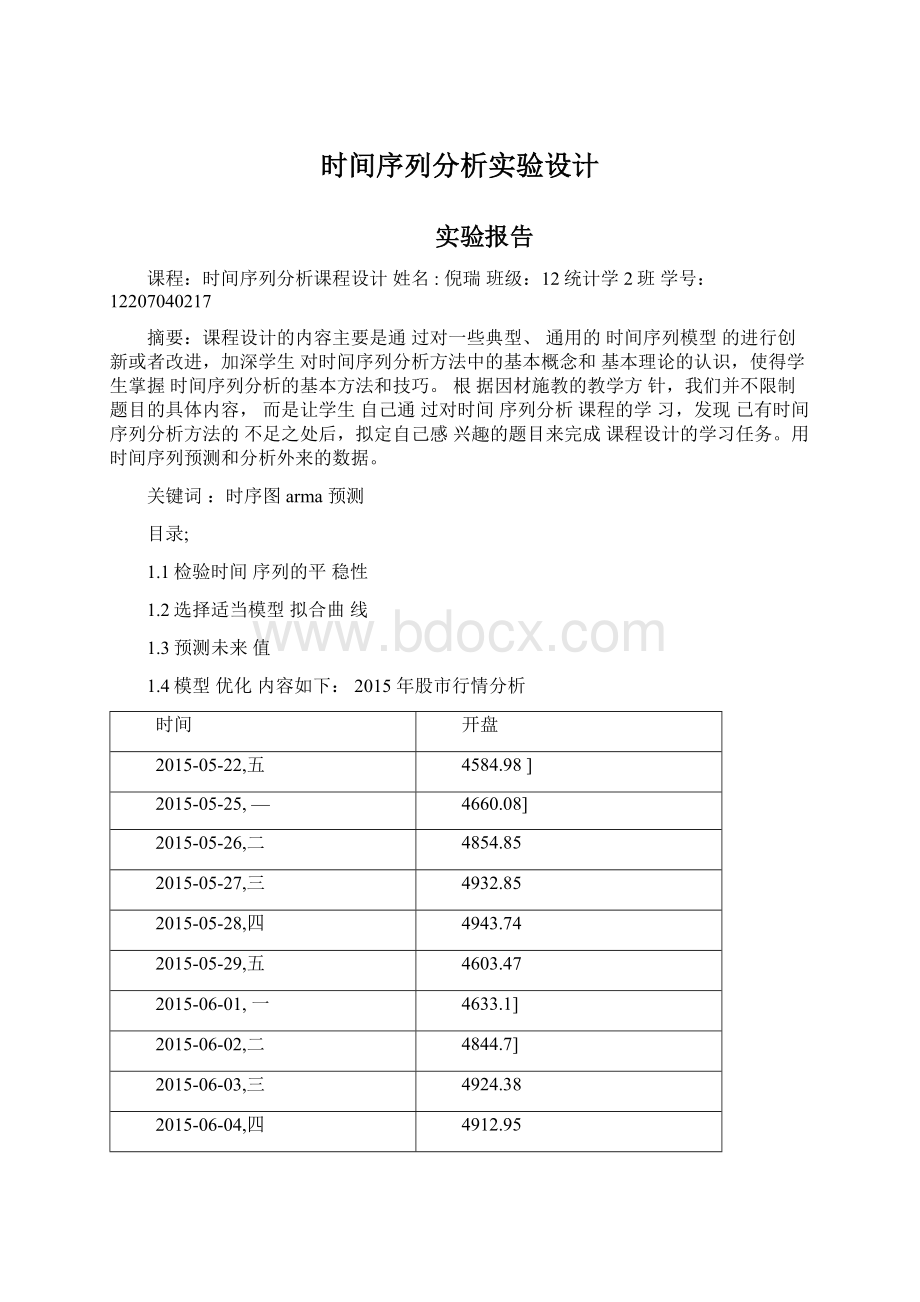
4912.95
2015-06-05,五
5016.09
2015-06-08,一
5045.69]
2015-06-09,二
5145.98]
2015-06-10,三
5049.2
2015-06-11,四
5101.44
2015-06-12,五
5143.34
2015-06-15,一
5174.42
2015-06-16,二
5004.41
2015-06-17,三
4890.55]
2015-06-18,四
4942.52
2015-06-19,五
4689.93
2015-06-23,二
4471.61
2015-06-24,三
4604.58
2015-06-25,四
4711.76
2015-06-26,五
4399.93
请你
(1)写出一个恰当的模型实现上述想法;
(2)利用Eiews软件进行分析预测;
(3)比较这个模型和其它模型对数据拟合的差异,给出最优模
型,并给出给出最小均方误差预测。
0Senes:
OUTPUTWorkfik:
数摄:
Un卅l«
T,-BX
ViewProcObject|PropertiesTTPrint]NameFreezeDefault存]SortEdit-ASmpi-
Lastupdated:
06/28?
15-23:
33
Importedfrom‘D:
\360曲ta唾要數据蛾的文档谶据WsjC
5/22/2015
4584.98
5/25;
2015
4660,08
5/26/2015
5/27/2015
4932.B5
5/2別2015
494374
5Z29/2015
6/01/2015
463310
6/02/2015
4&
44.70
6/03/2015
6/04/2015
6/05^2015
6/0872015
5045.69
6/09/2015
5145.98
6/10/2015
5049.20
6/11/2015
6/12/2015
6/15/2015
6/16^2015
6/17/2015
90.55
6/18/2015
4
1Ifl
.1►
时序图如下
View
Proc
ObjectProperties
PrintNameFreeze
Default▼
Options
SampleG
图形一直呈增长趋势,无界且不规律,不为平稳序列
其自相关图如下
ViewProcObjectProperties[PrintNameFreezeSampleGenrSheetGraphStats
Date:
Q6/29/15Time:
00:
00
Sample:
5/25/20156/25/2015
IncludedotiseRations:
25
Autocorrelation
PartialCorrelation
ACPACQ*StatProb
II
|
1
10.654065412.0200.0Q1
1
20.415-002117.0790000
I
-1
303270111203590000
□1
1匚
40179-0.130213840.000
5-0.003-015821.3840.001
1□
6*0.133*0.11822.0090.001
1口
1匚
7-0265-0.18024.6490.001
U
8-0.348-0.08829.4440.000
二
9-0395-0112360360.000
[—
|n
10-0413-0091439050000
||_
11-0.3570.019500450.000
I1
12-0294-0052545440000
其自相关图不具有短期相关性,进一步说明其不平稳下面进行adf单位根检验:
r
^3Series:
OUTPUTWorkfile:
St3s:
:
Untitled\
—
nx
ViewProcObject
Properties|IPrint|Name
Freeze|
Sample
GenrSheet
Graph
Stats[I
AugmentedDickey^ullerUnitRootTestonOUTPUT
NullHypothesis:
OUTPUThasaunitrootExogenous:
Constant
LagLengtfi:
4(Automatic-basedonSIC.maxiag=5)
t-Statistic
Prob/
Ajgmen憶dDickey-Fullerteststatist)亡
-D649221
08379
Testcriticalvalues:
1%level5%level10%level
-3808546
-3020686
■2.650413
'
MacKinnon(1996)one-sidedp-values.
AugmentedDickey-FullerTestEquationDependentVariable:
D(OUTPUT)Method:
LeastSquares
06/29/15Time;
01
Sample(adjusted):
5/29/20156/25/2015includedobservations:
20afteradjustments
Variable
Coefficient
Std.Error
Prob
OUTPUTM}
-0169533
0261132
-0649221
0.5267
D(OUTPUT(-1)>
0204768
0325980
0628162
05400
有单位根检验P0.05,接受原假设,不平稳
1,2
对该序列进行12步的差分的新序列
画时序图,如下
有图可看出一阶差分后其序列始终围绕0波动,平稳
Series:
¥
FWorkfile®
®
Untitled\_BX
VieivProcObjectPropertiesPrintNameFreezeSampleGenrSheetGraphStatsI
AugmentedDickey-FullerUnitRootTeston¥
F
YFhasaunitroot
Exogenous:
LagLength:
2(Automatic-basedonSIC,maxlag=2)
Prob.*
AugmentedDickey-Fullerteststatistic
-8.794844
0.0000
Testcriticalvalues:
1%level
5%level10%level
■4,297073
-3,212696
-2747676
^MacKinnon(1995)one-sidedp-vaiues.
Warning:
Probabilitiesandcriticalvaluescalculatedfor20observationsandmaynotbeaccurateforasamplesizeof10
AugmentedDickey-FjiierTestEquation
DependentVariable:
D(YF)
MethodLeastSquares
06/29/15Time:
Q0:
24
Sample(adjusted):
5/12/20155/25/2015
Includedobservations:
10afteradjustments
VariableCoefficientStdErrorVSiatisticProb.
Prob.
YF(-1)
-5.711435
0649407
-8794844
0.0001
D{YF(-D)
2.395406
0.495834
4.821336
00Q29
D(YFH))
0505325
0.1848&
5
2733621
00340
C
285.8B61
2911.220
0.098201
0.9250
R*squared
0997962
Meandependent'
^ar
*9021.978
AdjustedR-squared
0.990943
S.D.dependentwar
163702.6
S,Eofregression
9051213
Akaikeinfocriterion
21.34836
Sumsquaredresid
492E+0B
Schwarzcriterion
21.46939
Loglikelihood
-102741S
Hannan-Quinncriter
21.21559
F-statisflc
979.3384
Durbin-Watsonstat
1.845358
Prot)(F-statistic)
0.000000
一阶差分后的自相关图不具有短期自相关性
下作xf二yf-yf(-12)
Equation:
U1FTTILEDTorkfile:
UNTITLED:
tIL.・_□X
Object
Print
f-JameiFreeze
Estimate
Forecast
•」』
Stats
Resids
DependentVanabfe:
Method:
09:
50
6/10/20156/25/2015
Indudedobservations:
12afteradjustments
Convergenceachievedafter34iterations
StdEfTort-Statistic
-10917.88
16902M-0.064592
0.9498
AR
(1)
0.990101
01547366.398669
R-squared
080647S
Meandependentvar
-27.84917
0.787126
S.D.dependentvar
384.2612
SE.ofregression
1772914
Akaikein1ociterian
13.34448
314322.3
13.42530
LogliKeiitiood
*7906687
Hannan-Quinnenter.
13.31456
F-statistic
41.67383
Durbin-Watsmnstat
1.517196
Prob(F-statistic)
0.000073
InvertedARRoots
99
预测未来两年的数值
[=\Etiuation:
UHTITLEDTorkflie:
01TTITLED:
U.□X
.■'
e'
/\ProcObjectPrintF'
JamE
^eezeEstateForest
Reside
包逼:
WAA匸AA
RncKtainplCLS.^lfilS包戈创为015
MfUMdiumplt6.'
10/20156-2&
201:
5
■^JOSCOD»
r^Kti-.E12
gl/ei-iSks-aTMErn^r刃7W1
桃紀畑心0住153SC77
AT心*沦E^W3m&
Si
pie皆二卫国OMn0021632
殉P呻2a35i即
^tr*x^napowr003^353
Cwa-ii-sPro»
WC6li3z-5
由其可口呈增长趋势,说明其是单调减序列
 升级会员
升级会员 