最新剑桥雅思49小作文题目分类汇总Word格式.docx
《最新剑桥雅思49小作文题目分类汇总Word格式.docx》由会员分享,可在线阅读,更多相关《最新剑桥雅思49小作文题目分类汇总Word格式.docx(22页珍藏版)》请在冰豆网上搜索。
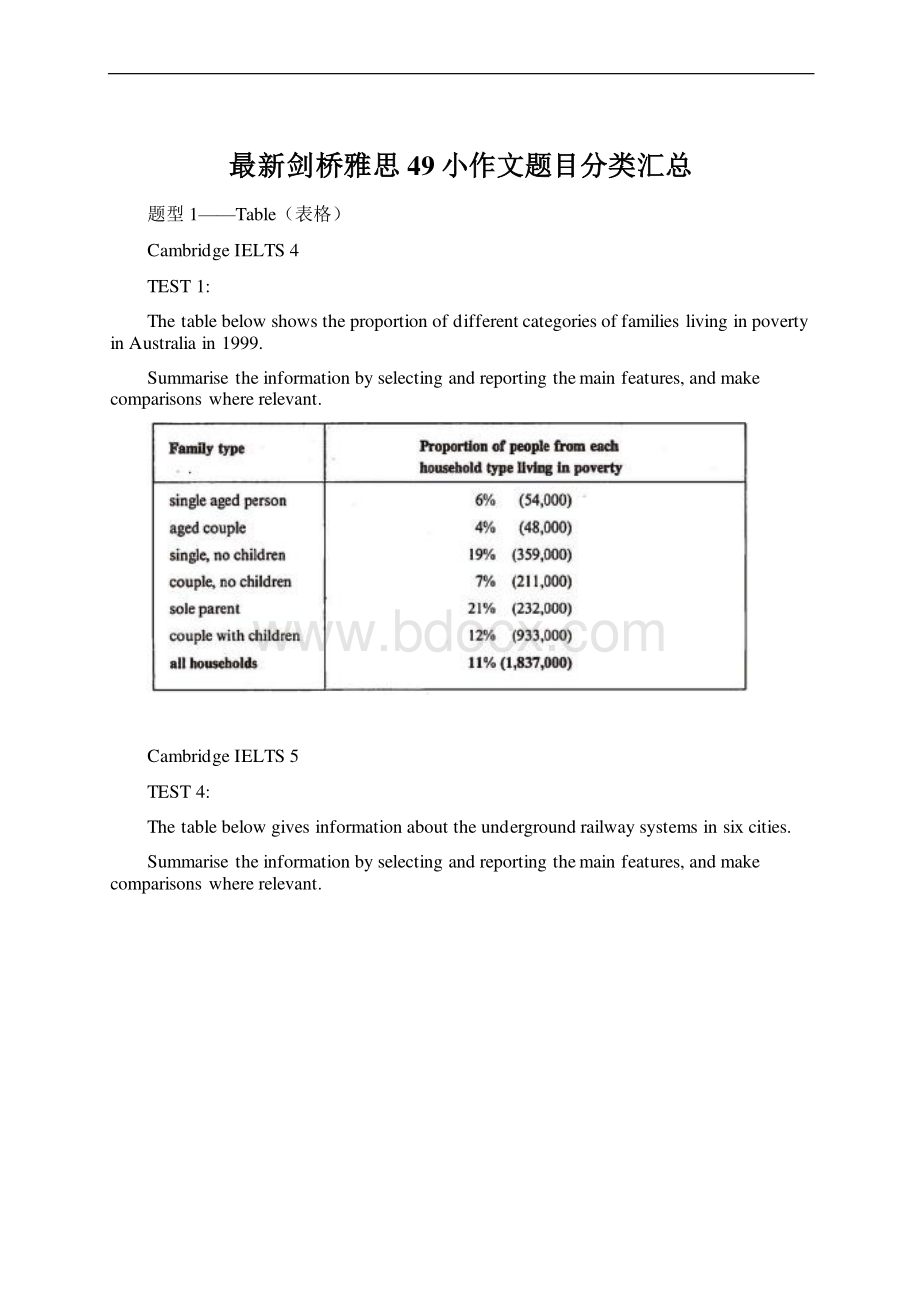
ThetablebelowshowstheproportionofdifferentcategoriesoffamilieslivinginpovertyinAustraliain1999.
Summarisetheinformationbyselectingandreportingthemainfeatures,andmakecomparisonswhererelevant.
CambridgeIELTS5
TEST4:
Thetablebelowgivesinformationabouttheundergroundrailwaysystemsinsixcities.
CambridgeIELTS6
TEST2:
ThetablebelowgivesinformationaboutchangesinmodesoftravelinEnglandbetween1985and2000.
CambridgeIELTS7
Thetablebelowgivesinformationonconsumerspendingondifferentitemsinfivedifferentcountriesin2002.
题型2——LineGraph(线性图)
Thegraphblewshowstheproportionofthepopulationaged65andoverbetween1940and2040inthreedifferentcountries.
Summariestheinformationbyselectingandreportingthemainfeatures,andmakecomparisonswhererelevant.
CambridgeIELTS9
CambridgeIELTS7
TheparghbelowshowstheconsumptionoffishandsomedifferentkindsofmeatinEuropeancountrybetween1979and2004.
Summarisetheinformationbyselectingandreportingthemainfeatures,andmakecomparisonswhererelevant.
CambridgeIELTS8
ThegraphbelowshowsthequantitiesofgoodstransportintheUKbetween1974and2002byfourdifferentmodesoftransport.
Summarisetheinformationbyselectingandreportingthemainfeaturesandmakecomparisonswhererelevant.
题型3——BarChart(条形图/柱状图)
TEST3:
Thechartbelowshowsthedifferentlevelsofpost-schoolqualificationsinAustraliaandtheproportionofmenandwomenwhoheldthemin1999.
Summariestheinformationbyselectingandreportingthemainfeatures,andmakecomparisonswhererelevant.
Thechartsbelowshowthemainreasonsforstudyamongstudentsofdifferentagegroupsandamountofsupporttheyreceivedfromemployers.
ThechartsbelowgiveinformationaboutUSAmarriageanddivorceratesbetween1970and2000,andthemaritalstatusofadultAmericaintwooftheyears.
Thechartbelowshowsinformationaboutchangesinaveragehousepricesinfivedifferentcitiesbetween1990and2002comparedwithaveragehousepricesin1989.
题型4——PieChart(饼图)
ThepiechartsbelowshowunitsofelectricityproductionbyfuelsourceinAustraliaandFrancein1980and2000.
ThethreepiechartsbelowshowthechangesinannualspendingbyaparticularUKschoolin1981,1991,and2001.
题型5——混合图
ThegraphblewshowsthedemandelectricityinEngliandduringtypicaldaysinwinterandsummer.ThepiechartshowshowelectricityisusedinanaverageEnglishhome.Summarisetheinformationbyselectingandreportingthemainfeaturesandmakecomparisionswhereralevant.
ThechartsbelowgiveinformationabouttraveltoandfromtheUK,andaboutthemostpopularcountriesfromUKresidentstovisit.
Thegraphandtablebelowgiveinformationaboutwateruseworldwideandwaterconsumptionintwodifferentcountries.
CambridgeIELTS8
Thepiechartbelowshowsthemainreasonswhyagriculturallandbecomeslessproductive.Thetableshowshowthesecausesaffectedthreeregionsoftheworldduringthe1990s.
Summarisetheinformationbyselectingandreportingthemainfeatures,andmakecomparisonswhererelevant
题型6——ProcessDiagram(流程图)
Thediagramsbelowshowthelifecycleofthesilkwormandthestages
 升级会员
升级会员 