国际经济学AnswersChap02.docx
《国际经济学AnswersChap02.docx》由会员分享,可在线阅读,更多相关《国际经济学AnswersChap02.docx(20页珍藏版)》请在冰豆网上搜索。
国际经济学AnswersChap02
Answerstoin-textQuestionsinEconomics(5thed)
Chapter2
Page
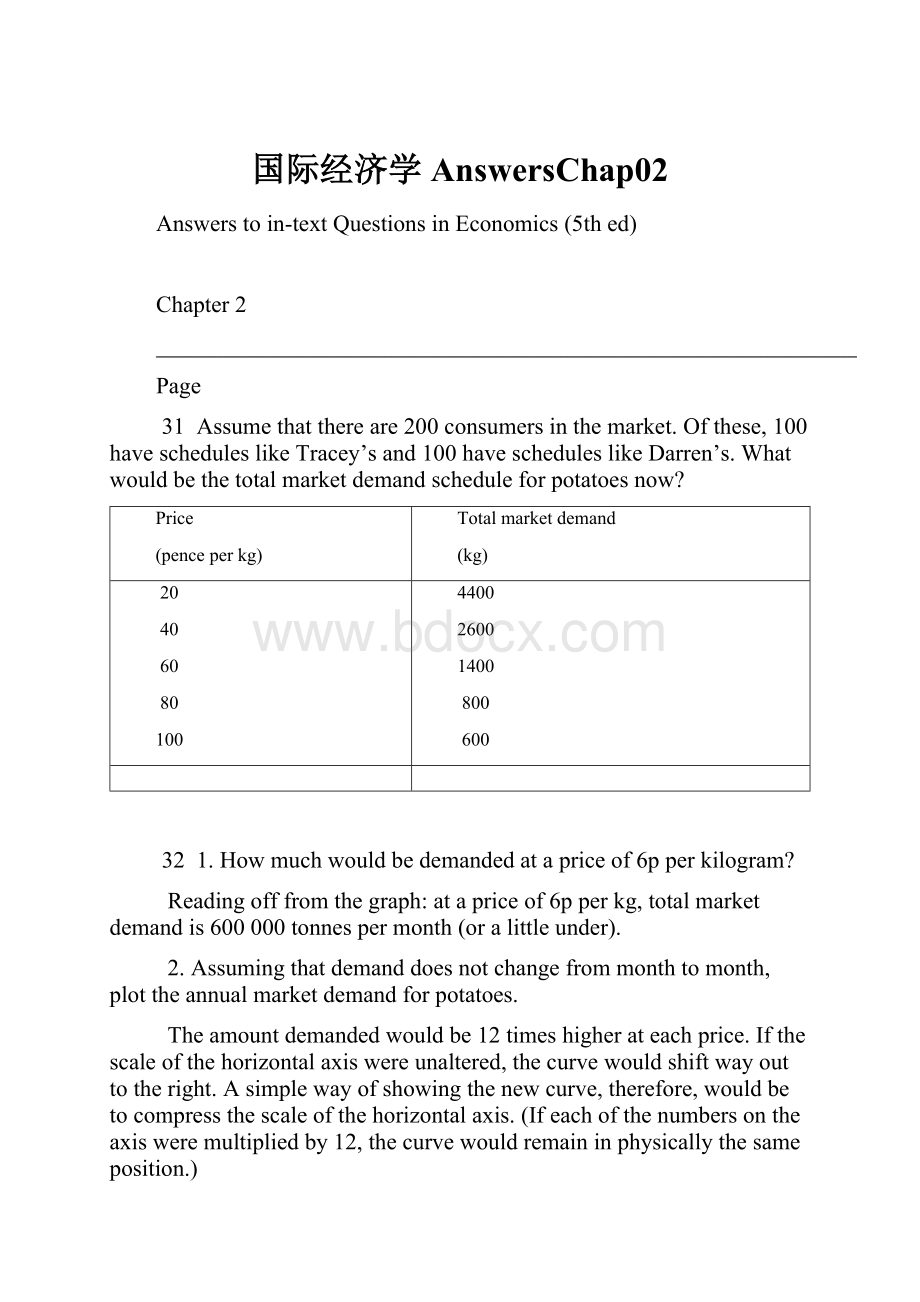
31Assumethatthereare200consumersinthemarket.Ofthese,100havescheduleslikeTracey’sand100havescheduleslikeDarren’s.Whatwouldbethetotalmarketdemandscheduleforpotatoesnow?
Price
(penceperkg)
Totalmarketdemand
(kg)
20
40
60
80
100
4400
2600
1400
800
600
321.Howmuchwouldbedemandedatapriceof6pperkilogram?
Readingofffromthegraph:
atapriceof6pperkg,totalmarketdemandis600000tonnespermonth(oralittleunder).
2.Assumingthatdemanddoesnotchangefrommonthtomonth,plottheannualmarketdemandforpotatoes.
Theamountdemandedwouldbe12timeshigherateachprice.Ifthescaleofthehorizontalaxiswereunaltered,thecurvewouldshiftwayouttotheright.Asimplewayofshowingthenewcurve,therefore,wouldbetocompressthescaleofthehorizontalaxis.(Ifeachofthenumbersontheaxisweremultipliedby12,thecurvewouldremaininphysicallythesameposition.)
1.DrawTracey’sandDarren’sdemandcurvesforpotatoesononediagram.NotethatyouwillusethesameverticalscaleasinFigure2.1,butyouwillneedaquitedifferenthorizontalscale.
ThisisshowninDiagram2.1.
Page
322.Atwhatpriceistheirdemandthesame?
Thetwocurvescrossatapriceof10pperkgandatademandof10kgpermonth.
3.Whatexplanationscouldtherebeforthequitedifferentshapesoftheirtwodemandcurves?
OneexplanationcouldbethatTraceyisquitehappytoeatrice,pastaorbreadinsteadofpotatoes.Thuswhenthepriceofpotatoesgoesupsheswitchestotheseotherfoods,andswitchestopotatoeswhenthepriceofpotatoescomesdown.Darren,bycontrast,maynotseetheseotherfoodsasclosesubstitutesandthushisdemandforpotatoeswillbelesspricesensitive.(Seesection2.4onelasticity.)
33Doallthesesixdeterminantsofdemandaffectbothanindividual’sdemandandthemarketdemandforaproduct?
Allexceptthedistributionofincome.The(national)distributionofincomesimplyaffectsanindividual’sincomeandthusisnotaseparatedeterminantfromincome.
1.AssumethatinTable2.1thetotalmarketdemandforpotatoesincreasesby20percentateachprice–due,say,tosubstantialincreasesinthepricesofbreadandrice.Plottheoldandthenewdemandcurvesforpotatoes.Isthenewcurveparalleltotheoldone?
SeeDiagram2.2below.Asyoucansee,thecurvesarenotparallel.Aconstantpercentageincreaseinquantitydemandedgivesabiggerandbiggerabsoluteincreaseasquantityincreases.
2.Thepriceofporkrisesandyetitisobservedthatthesalesofporkincrease.Doesthismeanthatthedemandcurveforporkisupwardsloping?
Explain.
Nonotnecessarily.Forexample,thepriceofsubstitutessuchasbeef,chickenorlambmayhaverisenbyalargeramount.Insuchcasesthedemandcurveforporkwillhaveshiftedtotheright.Thusalthoughariseinthepriceofporkwillcauseamovementupalongthisnewdemandcurve,moreporkwillneverthelessbedemandedbecauseporkisnowrelativelycheaperthanthealternatives.
Page
341.CompletethedemandscheduleinTable2:
2uptoapriceof50.
P
Qd
5
10
15
20
25
30
35
40
45
50
9000
8000
7000
6000
5000
4000
3000
2000
1000
0
2.Whatisitaboutequation
(2)thatmakesthedemandcurve(a) downwardsloping;(b) astraightline?
(a)Thefactthatthe200Ptermhasanegativesign.ThismeansthatasPrises,soQdfalls.
(b)ThefactthatthereisnoPtoapowerterm.Thecurvethushasaconstantslopeof–1/200
1.Referringtoequation(3),ifthetermahasavalueof–50 000andthetermbavalueof0.001,constructademandschedulewithrespecttototalincome(Y).Dothisforincomesbetween£100millionand£300millionat£50millionintervals.
Y(millions)
Qd
100
150
200
250
300
50000
100000
150000
200000
250000
2.Nowusethisscheduletoplotademandcurvewithrespecttoincome.Commentonitsshape.
Thecurvewillbeanupward-slopingstraightline,crossingthehorizontalaxisat–50000.Itwouldriseby100 000unitsforeach£100 millionriseinnationalincome.(SeeDiagram2.3).
Page
35(Box2.1)Fromthisequation,calculatewhatwouldhappentothedemandforlambif:
(a)thepriceoflambwentupby10pperkg(at1985prices).
(b)thepriceofbeefwentupby10pperkg(at1985prices).
(c)personaldisposableincomeperheadwentupby£100perannum(at1985prices).
(a)Thedemandwouldgodownby1.12gramsperpersonperweek(i.e.10–0.112).
(b)Thedemandwouldgoupby1.25gramsperpersonperweek(i.e.100.125).
(c)Thedemandwouldgodownby1.98gramsperpersonperweek(i.e.1000.0198).
(Box2.1)1.HowdoestheintroductionoftheTIMEtermaffecttherelationshipbetweenthedemandforlamband(a)thepriceofbeefand(b)personaldisposableincomeperhead?
(a)Thedemandforlambislesssensitivetoachangeinthepriceofbeefthaninthefirstequation.
(b)Thedemandforlambisslightlymoresensitivetoachangeindisposableincomethaninthefirstequationandtherelationshipisnowapositiveone:
i.e.whenincomerises,thedemandforlambrises..
(Box2.1)2.Islambanormalgoodoraninferiorgood?
Aninferiorgoodinthefirstequationandanormalgoodinthesecond.Inthefirstequation,aspersonaldisposableincomerisessothedemandforlambfalls.Inthesecondequationaspersonaldisposableincomerisessothedemandforlambrises.Thereasonisthat,byintroducingtheTIMEterm,wearenowallowingforthefallindemandforlambovertimeasaresultofashiftintastesawayfrommeat.Inotherwords,thesecondequationallowsustotakethisfactoroutofaccountwhenlookingattheeffectofachangeinthepriceoflambonthedemandforlamb.
(Box2.1)Usethesecondequationtoestimatethedemandforlambin1994,1996and2000.Inwhichofthesethreeyearswastheestimationclosesttotheactualfigure?
Explainthedivergencesintheactualfiguresfromthefiguresderivedfromtheequation.
1994:
Qd=192.3–(0.530301.6)+(0.0738343.0)+(0.02618266)–(7.35229)
=192.3–159.85+25.31+215.74–213.21
=60.29(gramsperpersonperweek)
1996:
Qd=192.3–(0.530296.2)+(0.0738325.6)+(0.02618607)–(7.35231)
=192.3–156.99+24.03+224.64–227.91
=56.07(gramsperpersonperweek)
2000:
Qd=192.3–(0.530310.7)+(0.0738320.1)+(0.02619604)–(7.35235)
=192.3–164.67+23.62+250.66–257.32
=44.59(gramsperpersonperweek)
Theequationmostcloselypredictedtheactualconsumptionin1994:
actualconsumption(54gramspppw)was6gramspppwlessthanpredictedbytheequation.In1996and2000,consumptionwasapproximately10gramspppwmorethanpredicted.ThiscanbeexplainedbyBSE,whichcausedashiftindemandfrombeeftolambintheselatertwoyears.
371.Howmuchwouldbesuppliedatapriceof70pperkilo?
About430000tonnespermonth.
2.DrawasupplycurveforfarmerX.AretheaxesdrawntothesamescaleasinFigure2.4?
ThesupplycurveforfarmerXwillmerelyplottherelevanttwocolumnsfromTable2.3.TheverticalaxiscanbedrawntothesamescaleasinFigure2.4,butadifferentscalewillhavetobeusedforthehorizontalaxis(e.g.tonnesratherthanthousandsoftonnes).
381.Forwhatreasonsmightthesupplyofpotatoesfall?
Examplesinclude:
•Thecostofproducingpotatoesrises.
•Theprofitabilityofalternativecrops(e.g.carrots)rises.
•Apoorpotatoharvest.
•Farmersexpectthepriceofpotatoestorise(short-runsupplyfalls).
Page
382.Forwhatreasonsmightthesupplyofleatherrise?
Examplesinclude:
•Thecostofproducingleatherfalls.
•Theprofitabilityofproducingalternativeproductsdecreases.
•Thepriceofbeefrises.
•Along-runningindustrialdisputeinvolvingleatherworkersisresolved.
•Producersexpectthepriceofleathertofall(short-runsupplyincreases).
39Thisquestionisconcernedwiththesupplyofoilforcentralheating.Ineachcaseconsiderwhetherthereisamovementalongthesupplycurve(andinwhichdirection)orashiftinit(leftorright).(a)Newoilfieldsstartupinproduction.(b)Thedemandforcentralheatingrises.(c)Thepriceofgasfalls.(d)Oilcompaniesanticipateanupsurgeindemandforcentral-heatingoil.(e)Thedemandforpetrolrises.(f)Newtechnologydecreasesthecostsofoilrefining.(g)Alloilproductsbecomemoreexpensive.
(a)Shiftright.(b)Movementupalong(asaresultofariseinprice).(c)Movementdownalong(asaresultofafallinpriceresultingfromafallindemandaspeopleswitchtogas-firecentralheating).(d) Shiftleft(ifcompanieswanttoconservetheirstocksinanticipationofapricerise).(e)Shiftright(moreofagoodinjointsupplyisproduced).(f)Shiftright.(g)Movementupalong.
1.IfPwasoriginallymeasuredin£s,whatwouldhappentothevalueofthedtermifPwerenowmeasuredinpence?
Itwouldnowhaveavalueof10.
2.Drawtheschedule(table)andgraphforequation(8)forpricesfrom£1to£10.Whatisitintheequationthatdeterminestheslopeofthesupply‘curve’?
P
Qs
1
2
3
4
5
6
7
8
9
10
1500
2500
3500
4500
5500
6500
7500
8500
9500
10500
Thegraphisanupwardslopingstraightlinecrossingthehorizontalaxisat500units.Theslopeisgivenbythevalueofthedterm:
i.e.theslopeis1/1000(forevery£1increaseinprice,quantitys
 升级会员
升级会员 