数字信号处理实验快速傅里叶变换.docx
《数字信号处理实验快速傅里叶变换.docx》由会员分享,可在线阅读,更多相关《数字信号处理实验快速傅里叶变换.docx(17页珍藏版)》请在冰豆网上搜索。

数字信号处理实验快速傅里叶变换
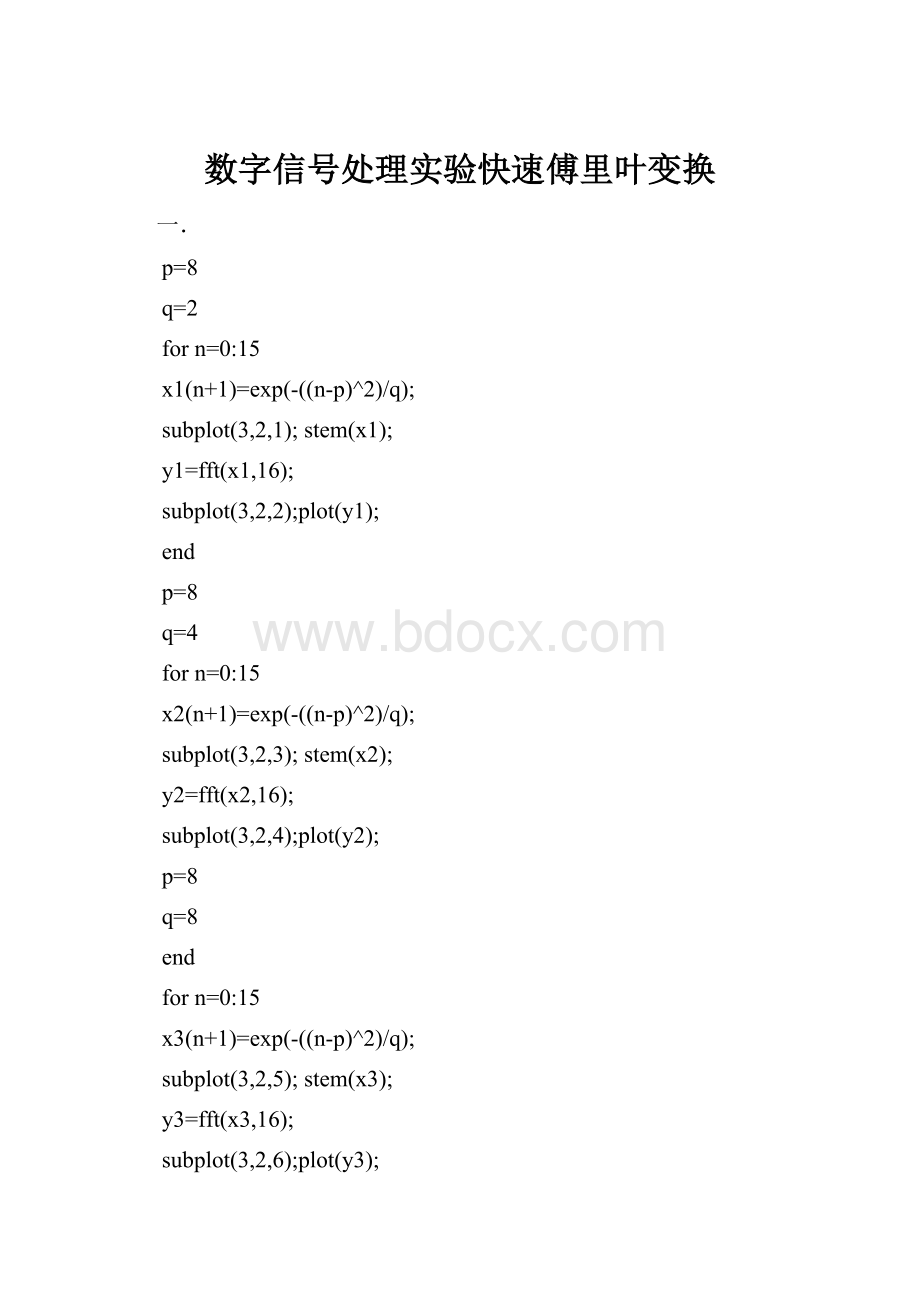
一.
p=8
q=2
forn=0:
15
x1(n+1)=exp(-((n-p)^2)/q);
subplot(3,2,1);stem(x1);
y1=fft(x1,16);
subplot(3,2,2);plot(y1);
end
p=8
q=4
forn=0:
15
x2(n+1)=exp(-((n-p)^2)/q);
subplot(3,2,3);stem(x2);
y2=fft(x2,16);
subplot(3,2,4);plot(y2);
p=8
q=8
end
forn=0:
15
x3(n+1)=exp(-((n-p)^2)/q);
subplot(3,2,5);stem(x3);
y3=fft(x3,16);
subplot(3,2,6);plot(y3);
end
p=8
q=8
forn=0:
15
x1(n+1)=exp(-((n-p)^2)/q);
subplot(3,2,1);stem(x1);
y1=fft(x1,16);
subplot(3,2,2);plot(y1);
end
p=13
q=8
forn=0:
15
x2(n+1)=exp(-((n-p)^2)/q);
subplot(3,2,3);stem(x2);
y2=fft(x2,16);
subplot(3,2,4);plot(y2);
p=14
q=8
end
forn=0:
15
x3(n+1)=exp(-((n-p)^2)/q);
subplot(3,2,5);stem(x3);
y3=fft(x3,16);
subplot(3,2,6);plot(y3);
end
二
p=0.1
f=0.0625
forn=0:
15
x1(n+1)=exp(-p*n).*sin(2*pi*f*n);
subplot(3,2,1);stem(x1);
y1=fft(x1,16);
subplot(3,2,2);plot(y1);
end
p=0.1
f=0.4375
forn=0:
15
x2(n+1)=exp(-p*n).*sin(2*pi*f*n);
subplot(3,2,3);stem(x2);
y2=fft(x2,16);
subplot(3,2,4);plot(y2);
end
p=0.1
f=0.5625
forn=0:
15
x3(n+1)=exp(-p*n).*sin(2*pi*f*n);
subplot(3,2,5);stem(x3);
y3=fft(x3,16);
subplot(3,2,6);plot(y3);
end
三.forn=0:
3
x1(n+1)=n;
end;
forn=4:
7
x1(n+1)=8-n;
end;
subplot(3,2,1);stem(x1);
y1=fft(x1,8);
subplot(3,2,2);plot(y1);
forn=0:
3
x2(n+1)=4-n;
end;
forn=4:
7
x2(n+1)=n-4;
end;
subplot(3,2,3);stem(x2);
y2=fft(x2,8);
subplot(3,2,4);plot(y2);
forn=0:
3
x1(n+1)=n;
end;
forn=4:
7
x1(n+1)=8-n;
end
forn=8:
32
x1(n+1)=0;
end;
subplot(3,2,1);stem(x1);
y1=fft(x1,32);
subplot(3,2,2);plot(y1);
forn=0:
3
x2(n+1)=4-n;
end;
forn=4:
7
x2(n+1)=n-4;
end;
forn=8:
32
x1(n+1)=0;
end;
subplot(3,2,3);stem(x2);
y2=fft(x2,32);
subplot(3,2,4);plot(y2);
四
f=1/16
forn=0:
15
x1(n+1)=sin(2*pi*0.125*n)+cos(2*pi*(0.125+f)*n);
end;
y1=fft(x1,16);
subplot(2,2,1);plot(y1);
f=1/64
forn=0:
15
x2(n+1)=sin(2*pi*0.125*n)+cos(2*pi*(0.125+f)*n);
end;
y2=fft(x2,16);
subplot(2,2,2);plot(y2);
f=1/16
forn=0:
127
x3(n+1)=sin(2*pi*0.125*n)+cos(2*pi*(0.125+f)*n);
end;
y3=fft(x3,128);
subplot(2,2,3);plot(y3);
f=1/64
forn=0:
127
x4(n+1)=sin(2*pi*0.125*n)+cos(2*pi*(0.125+f)*n);
end;
y4=fft(x4,128);
subplot(2,2,4);plot(y4);
(5)
clear;
fori=0:
15;
xa(i+1)=exp(-(i-8)^2/2);
end
fori=0:
15;
xb(i+1)=(exp(-0.1*i))*sin(2*pi*0.0625*i);
end
Xa=fft(xa);
Xb=fft(xb);
Xc=Xa.*Xb;
xc=ifft(Xc)
F1=fft(xa,31);
F2=fft(xb,31);
F3=F1.*F2;
f3=ifft(F3);
subplot(2,1,1);stem(f3);
f4=f3(1:
16);
f5=[f3(17:
31),0];
f6=f4+f5;
subplot(2,1,2);stem(f6);
*(6)
xc=[0,1,2,3,4,3,2,1];
xe=randn([1,512]);
subplot(4,1,1);
plot(xe);
xlabel('n');ylabel('xe(n)');title('Ëæ»úÐòÁÐʱÓò²¨ÐÎ');
Xe=fft(xe,71);
subplot(4,1,2);
plot(abs(Xe));
xlabel('k');ylabel('Xe(k)');title('Ëæ»úÐòÁÐƵÓò²¨ÐÎ');
Xc=fft(xc,71);
%ÖصþÏà¼Ó·¨
A=zeros([8,71]);
S=zeros([8,519]);
T=zeros([1,519]);
fori=1:
8
n=1+64*(i-1);
B=xe(n:
n+63);
A(i,:
)=fft(B,71);
A(i,:
)=A(i,:
).*Xc;
A(i,:
)=ifft(A(i,:
));
S(i,n:
(n+70))=A(i,:
);
T=T+S(i,:
);
end
F=fft(T);
subplot(4,1,3);
plot(T);
xlabel('k');ylabel('X(k)');title('Ëæ»úÐòÁÐÓëÈý½Ç²¨¾í»ýºóƵÓò²¨ÐΣ¨ÖصþÏà¼Ó·¨£©');
%Öصþ±£Áô·¨
A=zeros([9,71]);
S=zeros([1,576]);
xa=zeros([1,583]);
xa(8:
519)=xe;
fori=1:
9
n=1+64*(i-1);
B=xa(n:
n+70);
A(i,:
)=fft(B);
A(i,:
)=A(i,:
).*Xc;
A(i,:
)=ifft(A(i,:
));
S(n:
(n+63))=A(i,8:
71);
end
F=fft(S);
subplot(4,1,4);
plot(S);
xlabel('k');ylabel('X(k)');title('Ëæ»úÐòÁÐÓëÈý½Ç²¨¾í»ýºóƵÓò²¨ÐΣ¨Öصþ±£Áô·¨£©');
(7)
fori=0:
15;
xa(i+1)=exp(-(i-8)^2/2);
end
fori=0:
15;
xb(i+1)=(exp(-0.1*i))*sin(2*pi*0.0625*i);
end
k=16;
Xa=fft(xa,2*k);
Xb=fft(xb,2*k);
rm=real(ifft(conj(Xa).*Xb));
rm=[rm(k+2:
2*k)rm(1:
k)];
m=(-k+1):
(k-1);
stem(m,rm);
xlabel('m');ylabel('Rxaxb(m)');title('xaºÍxbµÄ»¥Ïà¹Øº¯Êý')
fori=0:
15;
xa(i+1)=exp(-(i-8)^2/2);
end
fori=0:
15;
xb(i+1)=(exp(-0.1*i))*sin(2*pi*0.0625*i);
end
k=16;
Xa=fft(xa,k);
Xb=fft(xb,k);
rm=real(ifft(conj(Xa).*Xb));
m=0:
15;
stem(m,rm);
xlabel('m');ylabel('Ñ�»·Ïà¹Ø');
8
(8)
fori=0:
15;
xa(i+1)=exp(-(i-8)^2/2);
end
fori=0:
15;
xb(i+1)=(exp(-0.1*i))*sin(2*pi*0.0625*i);
end
k=16;
Xa=fft(xa,2*k);
Xb=fft(xb,2*k);
rm=real(ifft(conj(Xa).*Xa));
rm=[rm(k+2:
2*k)rm(1:
k)];
m=(-k+1):
(k-1);
subplot(2,1,1);
stem(m,rm);
xlabel('m');ylabel('Rxa(m)');title('xaµÄ×ÔÏà¹Øº¯Êý')
rm=real(ifft(conj(Xb).*Xb));
rm=[rm(k+2:
2*k)rm(1:
k)];
m=(-k+1):
(k-1);
subplot(2,1,2);
stem(m,rm);
xlabel('m');ylabel('Rxb(m)');title('xbµÄ×ÔÏà¹Øº¯Êý')