雅思小作文折线图.docx
《雅思小作文折线图.docx》由会员分享,可在线阅读,更多相关《雅思小作文折线图.docx(8页珍藏版)》请在冰豆网上搜索。
雅思小作文折线图
Writingtaskone:
singlelinegraph
Youwillbegivenagraphwithasingleline.Yourtaskistowritea150wordreporttodescribetheinformationgiveninthegraph.Youarenotaskedtogiveyouropinion.Youshouldspendaroundtwentyminutesonthetask.Taskoneisnotworthasmanymarksastasktwoandsoyoushouldmakesurethatyoukeepwithintherecommendedtwentyminutetimeframe.
Whatisbeingtestedisyourabilityto:
∙objectivelydescribetheinformationgiventoyou
∙reportonatopicwithouttheuseofopinion
∙usesuitablelanguagetodescribethegraph
Sampletask
Youshouldspendabout20minutesonthistask.
Writeareportforauniversitylecturerdescribingtheinformationinthegraphbelow.
Writeatleast150words.
Whenyou’vefinishedthetask
Howgoodisyouranswer?
Checktheguidelinesbellowandreadthesampleanswer.
Guidelinesforagoodanswer
Doesthereporthaveasuitablestructure?
∙Doesithaveanintroduction,bodyandconclusion?
∙Doesitincludeconnectivewordstomakethewritingcohesivewithinsentencesandparagraphs?
Doesthereportusesuitablegrammarandvocabulary?
∙Doesitincludeavarietyofsentencestructures?
∙Doesitincludearangeofappropriatevocabulary?
Doesthereportmeettherequirementsofthetask?
∙Doesitmeetthewordlimitrequirements?
∙Doesitdescribethewholegraphadequately?
∙Doesitfocusontheimportanttrendspresentedinthegraphicinformation?
Sampleanswer
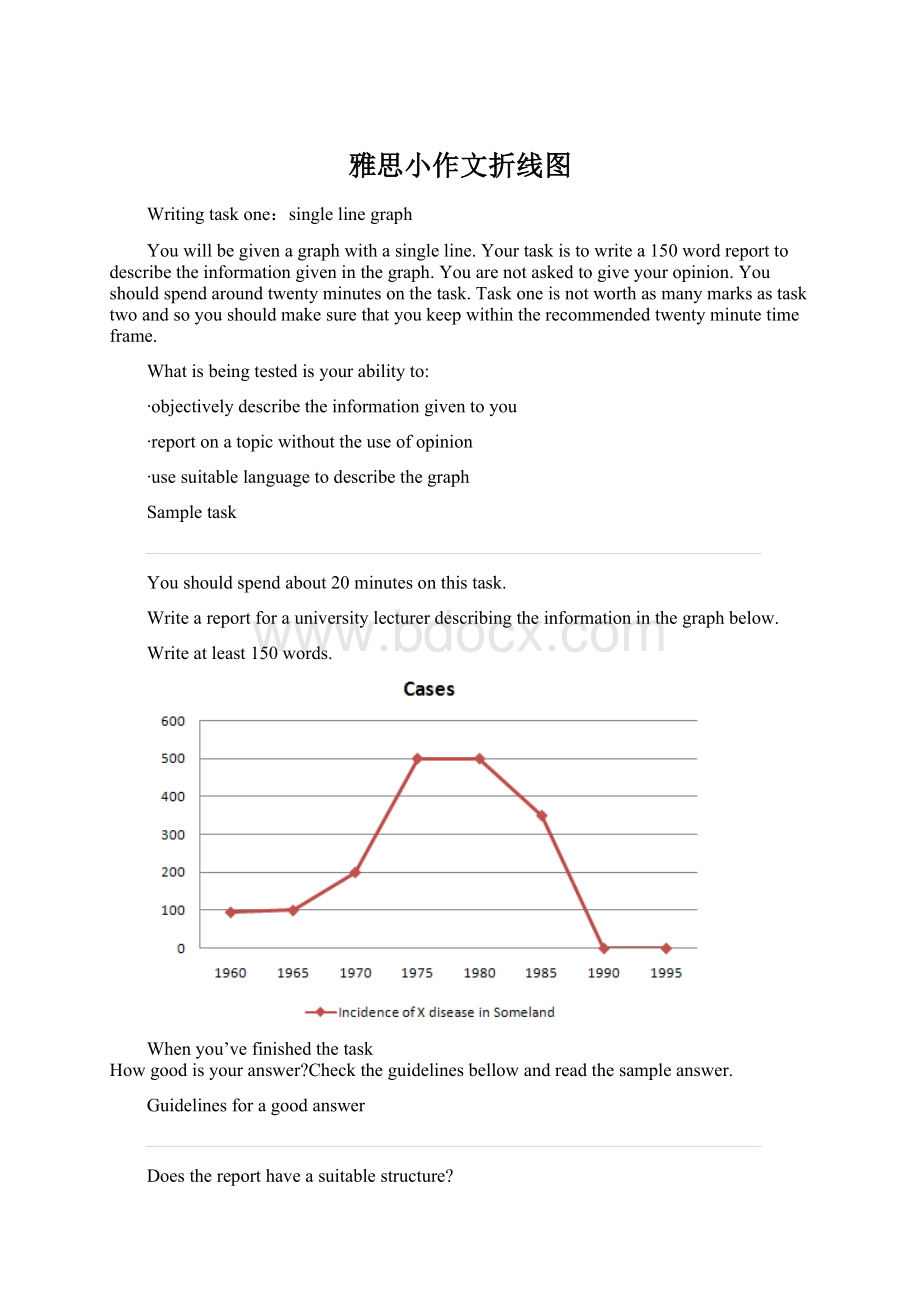
ThegraphshowsthenumberofcasesofXdiseaseinSomelandbetweentheyears1960and1995.Asanoveralltrend,itisclearthatthenumberofcasesofthediseaseincreasedfairlyrapidlyuntilthemidseventies,remainedconstantforaroundadecadeat500casesbeforedroppingtozerointhelate80s.
In1960,thenumberofcasesstoodatapproximately100.Thatnumberrosesteadilyto200by1969andthenmoresharplyto500in1977.Atthispointthenumberofcasesremainedstableuntil1984beforeplummetingtozeroby1988.From1988to1995Somelandwasfreeofthedisease.
Inconclusion,thegraphshowsthatthediseasewasincreasinglyprevalentuntilthe1980swhenitwaseradicatedfromSomeland.
Whatdoyouthink?
Whatisyouropinionofthissampleanswer?
Howwelldoesitmeettherequirementsoftheguidelines?
Readtheteacher'scommentsonthisanswer.
Teacher'scommentsonthesampleanswer
“Thereportstructureiseasytofollowandlogicalwithaclearintroduction,bodyandconclusion.Thecandidateusescohesivewordstoconnectpiecesofinformationandmakethewritingflowsuchas‘until’and‘before’inthesecondsentence.Thecandidateusesavarietyofgrammaticalstructuresandvocabularysothatthewritingisnotrepetitive.
Intermsoftaskrequirementsthereportisalittleshortbutthisisbecausethesimplegraphusedasanexampledoesnothavesufficientinformationforthecandidatetodescribe.IntherealIELTStestthegraphwillhavemoreinformationandsotheneedtolookfortrendswillbeevengreaterthaninthisexample.”
StrategiesforimprovingyourIELTSscore
Selectinginformation
Itisimportantthatyoudescribethewholegraphfully.However,thisdoesnotmeanthatyoushouldnoteeverydetail.Inmostcasestherewillbetoomuchinformationforyoutomentioneachfigure.Youwillthereforeneedtosummarisethegraphbydividingitintoitsmainparts.Thisiswhatwemeanbydescribingthetrends.
Forexample,inachronologicallinegraphitmightseemsensibletodescribetheinformationyearbyyearorperiodbyperiod.Thegraphabovegivestheinformationinfiveyearsectionssowecouldwriteourreportlikethis:
ThenumberofcasesofXdiseasestartedat50in1965andthenwentupgraduallyto100in1965andcontinuedupto200in1970andthenwentupmoresharplyto380in1975.
Whilethiswayofdescribingtheinformationmaybeaccurate,itdoesnotmeaningfullysumuptheinformationinthegraph.Infact,theinformationinthegraphwouldmostmeaningfullybedescribedinfourchronologicalsectionsfollowingtheshapeofthegraph.
IntheSampleTask,thegraphshowsfourmaintrends:
∙first,agradualincreasefrom1960to1968
∙second,asteeperincreasefrom1968to1977
∙third,aplateaufrom1977to1983
∙fourth,adropfrom1983to1988
Thestructureofthereportmustshowthesefourmaintrendsclearly.
Reportstructure
Yourreportshouldbestructuredsimplywithanintroduction,bodyandconclusion.Tensesshouldbeusedappropriately.
Introduction
Usetwostandardopeningsentencestointroduceyourreport.Theseopeningsentencesshouldmakeupthefirstparagraph.Sentenceoneshoulddefinewhatthegraphisabout;thatis,thedate,location,whatisbeingdescribedinthegraphetc.Forexample:
ThegraphshowsthenumberofcasesofXdiseaseinSomelandbetweentheyears1960and1995…
Noticethetenseused.Eventhoughitdescribesinformationfromthepast,thegraphshowstheinformationinthepresenttime.
Noticethatthesampleopeningsentencedoesnotsimplycopythewordsusedonthegraphicmaterial.Copiedsentenceswillnotbeassessedbytheexaminerandsoyouwasteyourtimeincludingthem.
Describingtheoveralltrend
Sentencetwo(andpossiblythree)mightsumuptheoveralltrend.Forexample:
ItcanbeclearlyseenthatXdiseaseincreasedrapidlyto500casesaroundthe1980sandthendroppedtozerobefore1999,whileYdiseasefellconsistentlyfromahighpointofnearly600casesin1960tolessthan100casesin1995.
Noticethetenseused.Herewearetalkingabouttheoccurrenceofthediseaseinthepast.
Describingthegraphindetail
Thebodyofthereportwilldescribethegraphorgraphsindetail.Youwillneedtodecideonthemostclearandlogicalordertopresentthematerial.
Linegraphsgenerallypresentinformationinchronologicalorderandsothemostlogicalorderforyoutowriteuptheinformationwould,mostprobablybefromearliesttolatest.Bargraphs,piechartsareorganisedindifferentwaysandsoyouneedtodecideontheorganisationofeachone.
Concludingsentences
Yourreportmayendwithoneortwosentenceswhichsummariseyourreporttodrawarelevantconclusion.
Grammarandvocabulary
Avoidingrepetition
Youwillreceiveahighermarkifyourwritingusesarangeofstructuresandvocabularycorrectlyratherthanalimitednumber.Forexample,thecandidatewhowrites:
ThenumberofcasesofXdiseasestartedat50in1965andthenwentupto200in1970andthenwentupto500in1980andthenwentdowntozeroin1990.
willlosemarksforbeingrepetitive.Youshouldthereforepractisewritingreportsusingawidevarietyoftermstodescribethedifferentmovementsinthegraphsanddifferentstructurestovaryyourwriting.
Describingtrends
Trendsarechangesormovements.Thesechangesarenormallyexpressedinnumericitems,forexample,population,productionvolumesorunemployment.Therearethreebasictrends:
Expressingmovement:
nounsandverbs
Foreachtrendthereareanumberofverbsandnounstoexpressthemovement.Wecanuseaverbofchange,forexample:
Unemploymentlevelsfell
Orwecanusearelatednoun,forexample:
Therewasafallinunemploymentlevels
Direction
Verbs
Nouns
Rose(to)
Increased(to)
Wentup(to)
Climbed(to)
Boomed
Arise
Anincrease
Growth
Anupwardtrend
Aboom(adramaticrise)
Fell(to)
Declined(to)
Decreased(to)
Dipped(to)
Dropped(to)
Wentdown(to)
Slumped(to)
Reduced(to)
Adecrease
Adecline
Afall
Adrop
Aslump(adramaticfall)
Areduction
Levelledout(at)
Didnotchange
Remainedstable(at)
Remainedsteady(at)
Stayedconstant(at)
Maintainedthesamelevel
Alevellingout
Nochange
Fluctuated(around)
Peaked(at)
Plateaued(at)
Stoodat(weusethisphrasetofocusonaparticularpoint,beforewementionthemovement,forexample:
Inthefirstyear,unemploymentstoodat…)
Afluctuation
Reachedapeak(of)
Reachedatplateau(at)
Describingthemovement:
adjectivesandadverbs
Sometimesweneedtogivemoreinformationaboutatrendasfollows:
Therehasbeenaslightincreaseinthevalueofthedollar(degreeofchange)
Unemploymentfellrapidlylastyear(thespeedofchange)
Rememberthatwemodifyanounwithanadjective(aslightincrease)andaverbwithanadverb(toincreaseslightly).
Describingthedegreeofchange
Adjectives
Adverbs
dramatic
dramatically
sharp
sharply
huge
enormous
enormously
steep
steeply
substantial
substantially
considerable
considerably
significant
significantly
marked
markedly
moderate
moderately
slight
slightly
small
minimal
minimally
Describingthespeedofchange
Adjectives
Adverbs
rapid
rapidly
quick
quickly
swift
swiftly
sudden
suddenly
steady
steadily
gradual
gradually
slow
slowly
Exercise1
Usethefollowingtermsandanyothersnecessarytodescribethegraphbelow.
initially,stoodat,dip/dipped,peak/peaked,level/levelledout
Wecandescribeatrendbylookingat:
∙thedifferencebetweentwolevels
∙theendpointofthetrend
Describingthedifferencebetweentwolevels
Thisyearunemploymenthasincreased by 20,000cases(thedifferencebetweenthisyearandlastyearis20,000cases).
Thisyeartherehasbeenanincreaseinunemployment of 5%.
Noticetheprepositions.Weusetoincrease by (withtheverb)andanincrease of (withthenoun).
Describingtheendpoint
Thisyearunemploymenthasrisento10%(theendresultisthatunemploymentisupto10%).
Thisyeartherehasbeenariseinunemploymentto10%.
Noticetheprepositions.Weusetorise to (withtheverb)andarise to (withthenoun).
Exercise2
Write3sentencesdescribingthegraphbelowusing by, of
 升级会员
升级会员 