信号与系统.docx
《信号与系统.docx》由会员分享,可在线阅读,更多相关《信号与系统.docx(12页珍藏版)》请在冰豆网上搜索。

信号与系统
信号与系统实习报告
中国地质大学(武汉)机械与电子信息学院
2015年6月2日
实验
(一)
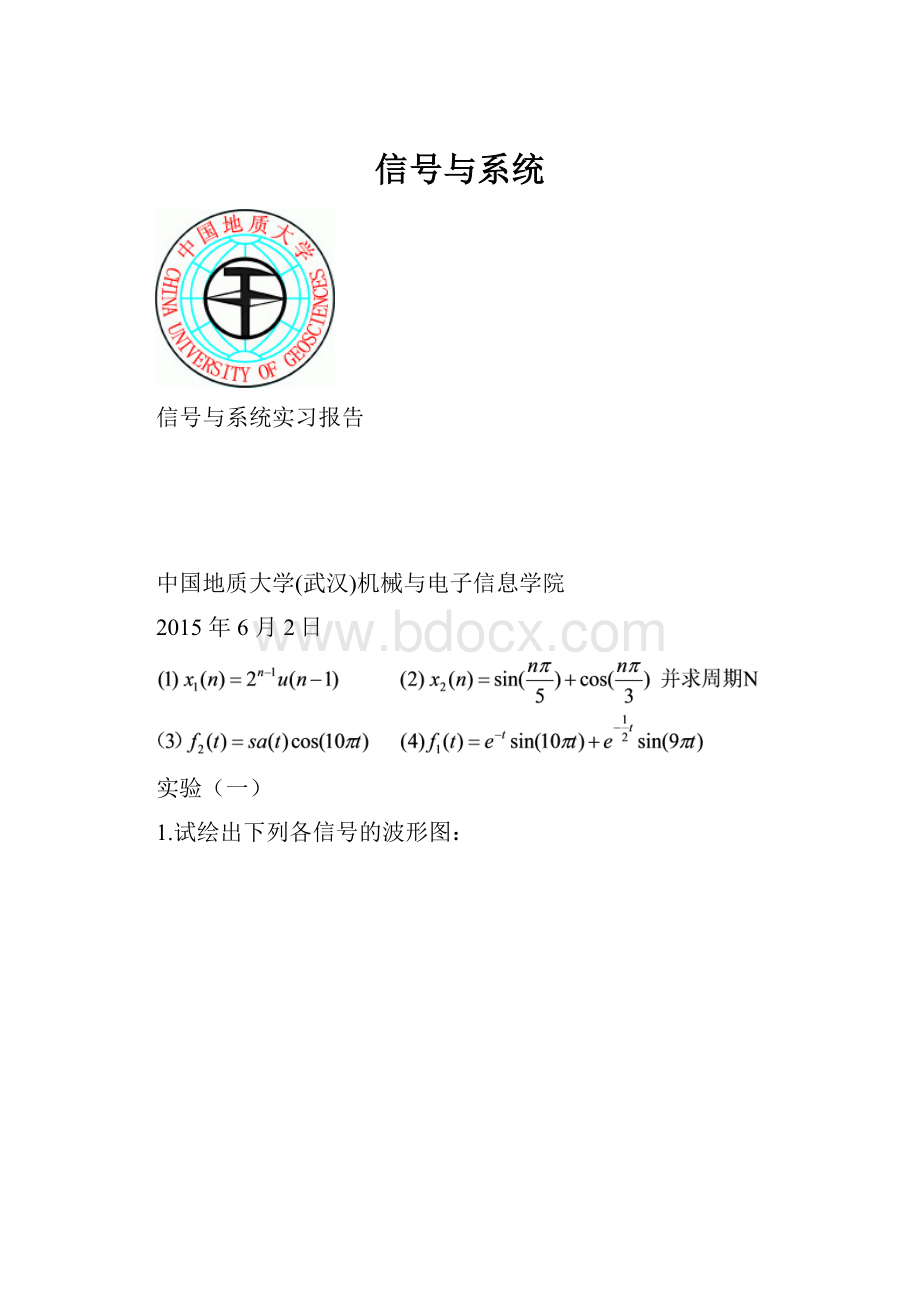
1.试绘出下列各信号的波形图:
其代码为:
n=-1:
15;
x1=2.^(n-1);
subplot(2,1,1);stem(n,x1,'fill');gridon;xlabel('n');ylabel('x1(n)');title('f1=2^(n-1)*u(n-1)');
n=-8*pi:
8*pi;x2=sin(n*pi/5)+cos(n*pi/3);
subplot(2,1,2);stem(n,x2,'fill');gridon;xlabel('n');ylabel('x2(n)');title('f2=sin(nπ/5)+cos(nπ/3)');
t=-2*pi:
0.01:
pi;
f1=exp(-t).*sin(10*pi*t)+exp(-0.5*t).*sin(9*pi*t);
subplot(2,1,1);plot(t,f1);gridon;xlabel('t');ylabel('f1(t)');title('f1=e^(-t)sin(10πt)+e^(-0.5t)sin(9πt)');
t=-2*pi:
0.01:
2*pi;
f2=sinc(t).*cos(10*pi*t);
subplot(2,1,2);plot(t,f2);gridon;xlabel('t');ylabel('f2(t)');title('f2=sa(t)cos(10πt))');
2.试绘出下图所示信号f(t)的波形图,并绘出f(-2t+2)及其偶分量Ev{f(t)}和奇分量Od{f(t)}的波形图。
其代码为:
t=-10:
0.01:
10;
f1=t.*(udt(t)-udt(t-1))+udt(t-1)-udt(t-2);
t1=-2*t+2;
f2=t1.*(udt(t1)-udt(t1-1))+udt(t1-1)-udt(t1-2);
subplot(2,2,1);
plot(t,f1);
axis([-1010-22]);
xlabel('t'),ylabel('f(t)');title('f(t)');gridon;
subplot(2,2,2);
plot(t,f2);
axis([-1010-22]);
xlabel('t'),ylabel('f(-2t+2)');title('f(-2t+2)');gridon;
t2=-t;
f3=t2.*(udt(t2)-udt(t2-1))+udt(t2-1)-udt(t2-2);
f4=(f1+f3)/2;
f5=(f1-f3)/2;
subplot(2,2,3);
plot(t,f4);
axis([-1010-22]);
xlabel('t'),ylabel('Ev{f(t)}');title('Ev{f(t)}');gridon;
subplot(2,2,4);
plot(t,f5);
axis([-1010-22]);
xlabel('t'),ylabel('Od{f(t)}');title('Od{f(t)}');gridon;
3.已知连续LTI系统的冲激响应,试绘出此系统的单位阶跃响应波形图。
其代码为:
dt=0.01;t1=-1:
dt:
10;
f1=(2*exp(-t1)-exp(-2*t1)).*uDT(t1);
t2=t1;
f2=1.*uDT(t2);
f=conv(f1,f2);
f=f*dt;
ts=min(t1)+min(t2);
te=max(t1)+max(t2);
t=ts:
dt:
te;
subplot(2,2,1);plot(t1,f1);
axis([min(t1),max(t1),min(f1)-abs(min(f1)*0.2),max(f1)+abs(max(f1)*0.2)])
title('f1(t)');xlabel('t')
subplot(2,2,2);plot(t2,f2);
axis([min(t2),max(t2),min(f2)-abs(min(f2)*0.2),max(f2)+abs(max(f2)*0.2)])
title('f2(t)');xlabel('t')
subplot(2,1,2);plot(t,f);
axis([min(t),max(t),min(f)-abs(min(f)*0.2),max(f)+abs(max(f)*0.2)])
title('f(t)=f1(t)*f2(t)');xlabel('t');
实验
(二)
1.已知调制信号,试画出此调制信号的时域波形图及其频谱。
其代码为:
dt=0.02;
t=-1:
dt:
1;
ft=4*rectpuls(t,0.5).*cos(12*pi*t);subplot(1,2,1);plot(t,ft);gridon;
N=1000;
k=-N:
N;
w=pi*k/(N*dt);
F=dt*ft*exp(-j*t'*w);
subplot(1,2,2);plot(w,abs(F));
xlabel('w'),ylabel('Fw')
title('amplitudespectrum'),gridon;
2.已知某LTI连续系统的系统函数,利用拉普拉斯变换法求系统的单位阶跃响应。
其代码为:
symsst;
f=sym('heaviside(t)');
F=laplace(f);F=simple(F);
L1=sym('(4*s^2+4*s^1+1)/(s^3+3*s^2+2*s)');
Ys=simple(L1*F);
yt=simple(ilaplace(Ys));
ezplot(yt,[0,10]);gridon;
3.试用MATLAB命令画出下列各系统的零极点分布图以及对应的单位取样响应h(n)的波形,并分析系统函数的极点对时域波形的影响。
其代码为:
figure();
B=[10];A=[1-0.8];
subplot(2,2,1);zplane(B,A);gridon;
legend('零点','极点');
title('零极点分布图');
legend('零点','极点');
subplot(2,2,2);impz(B,A,10);gridon;
B=[10];A=[10.8];
subplot(2,2,3);zplane(B,A);gridon;
legend('零点','极点');
title('零极点分布图');
legend('零点','极点');
subplot(2,2,4);impz(B,A,10);gridon;
figure();
B=[10];A=[1-1.20.72];
subplot(2,2,1);zplane(B,A);gridon;
legend('零点','极点');
title('零极点分布图');
legend('零点','极点');
subplot(2,2,2);impz(B,A,10);gridon;
B=[10];A=[1-1];
subplot(2,2,3);zplane(B,A);gridon;
legend('零点','极点');
title('零极点分布图');
legend('零点','极点');
subplot(2,2,4);impz(B,A,10);gridon;
figure();
B=[10];A=[1-1.61];
subplot(2,2,1);zplane(B,A);gridon;
legend('零点','极点');
title('零极点分布图');
legend('零点','极点');
subplot(2,2,2);impz(B,A,10);gridon;
B=[10];A=[1-1.2];
subplot(2,2,3);zplane(B,A);gridon;
legend('零点','极点');
title('零极点分布图');
legend('零点','极点');
subplot(2,2,4);impz(B,A,10);gridon;
figure();
B=[10];A=[1-21.36];
subplot(2,2,1);zplane(B,A);gridon;
legend('零点','极点');
title('零极点分布图');
legend('零点','极点');
subplot(2,2,2);impz(B,A,10);gridon;
4.已知系统的微分方程为
(1)试画出系统零极点分布图;
(2)试画出系统的频率特性曲线;
(3)求系统的冲激响应和阶跃响应;
(4)若激励信号f1(t)如图所示,求系统的零状态响应;
求系统的稳态响应。
其代码为:
symsst;
F1=sym('(2*s+6)/(s^2+6*s+6)');
f1=sym('heaviside(t)-heaviside(t-1)');
f2=sym('(3+cos(2*t)+cos(5*t))*heaviside(t)');
F2=laplace(f1);F2=simple(F2);
F3=laplace(f2);F3=simple(F3);
Fs=simple(F1*F2);
Fs1=simple(F1*F3);
yt1=simple(ilaplace(Fs));
yt2=simple(ilaplace(Fs1));
b=[26];
a=[165];
sys=tf(b,a);
subplot(3,3,1);pzmap(b,a);
w=-3*pi:
0.01:
3*pi;
H=freqs(b,a,w);
subplot(3,3,2),plot(w,abs(H)),gridon;
xlabel('\omega(rad/s)'),ylabel('|H(\omega)|'),title('幅频特性');
subplot(3,3,3),plot(w,angle(H)),gridon;
xlabel('\omega(rad/s)'),ylabel('\phi(\omega)'),title('相频特性');
t1=0:
0.02:
4;
subplot(3,3,4);impulse(sys,t1);gridon;title('冲击响应');
subplot(3,3,5);step(sys,t1);gridon;title('阶跃响应');
subplot(3,3,6);ezplot(yt1,[0,5]);gridon;title('激励f(t)=ε(t)-ε(t-1)响应');
subplot(3,1,3);ezplot(yt2,[0,40]);gridon;title('激励f(t)=3+cos(2t)+cos(5t)响应');