雅思小作文.docx
《雅思小作文.docx》由会员分享,可在线阅读,更多相关《雅思小作文.docx(9页珍藏版)》请在冰豆网上搜索。
雅思小作文
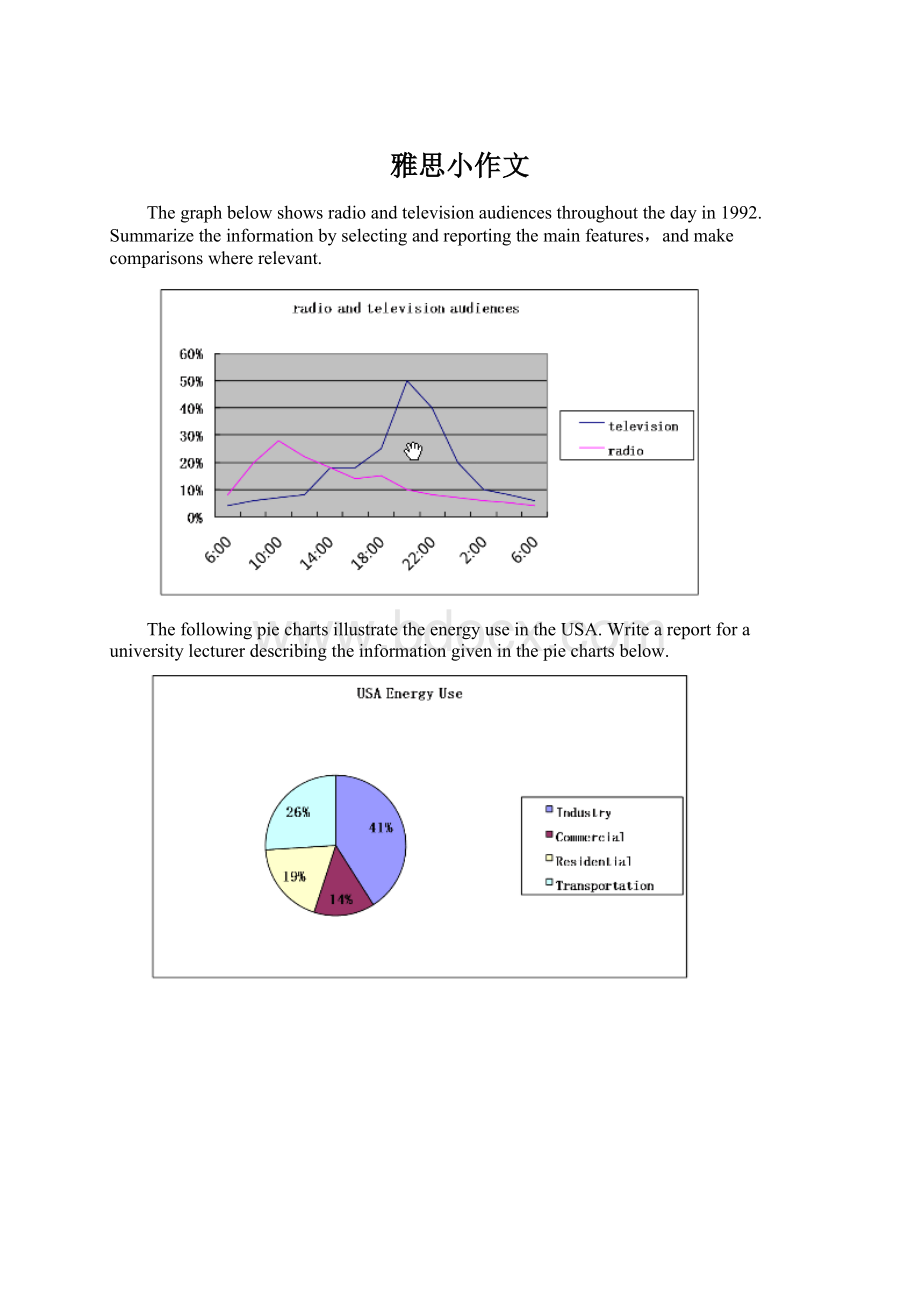
Thegraphbelowshowsradioandtelevisionaudiencesthroughoutthedayin1992.Summarizetheinformationbyselectingandreportingthemainfeatures,andmakecomparisonswhererelevant.
ThefollowingpiechartsillustratetheenergyuseintheUSA.Writeareportforauniversitylecturerdescribingtheinformationgiveninthepiechartsbelow.
ThefollowingtwopiesshowtheaveragefamilyincomeofNewZealandin1990andandthewaypeoplespendtheirincome.Writeareportforauniversitylecturerdescribingtheinformationgiveninthepiechartsbelow.
ThegraphbelowshowthenumberofhoursCanadiansspentonwatchingTVfrom1990to,andthenumberbyagein.Summarizetheinformationbyselectingandreportingthemainfeatures,andmakecomparisonswhererelevant.
ThegraphsbelowshowthemarriageanddivorcenumberintheUSandthemaritalstatusofitspopulationin1970and.Summarizetheinformationbyselectingandreportingthemainfeatures,andmakecomparisonswhererelevant.
ThegraphbelowshowstheparticipationofAustralianchildreninsportsoutsideschoolhoursin.Summarizetheinformationbyselectingandreportingthemainfeatures,andmakecomparisonswhererelevant.
Thechartbelowshowsthedifferentlevelsofpost-schoolqualificationsinAustraliaandtheproportionofmenandwomenwhoheldthemin1999.Summarizetheinformationbyselectingandreportingthemainfeaturesandmakecomparisonswhererelevant.
Thebarchartbelowshowsthethreemaincoursedoflanddamage(inmillionhectares)infourdifferentareasintheworld.Summarizetheinformationbyselectingandreportingthemainfeatures,andmakecomparisonswhererelevant.
Thechartbelowshowstheinformationoftheexpenditure(inmillion)oftransportationandcommunicationsinBritainin1970,1990and.Summarizetheinformationbyselectingandreportingthemainfeatures,andmakecomparisonswhererelevant.
ThetablebelowshowsthemonthlyexpenditureofanaverageAustralianfamilyin1991and.Summarizetheinformationbyselectingandreportingthemainfeatures,andmakecomparisonswhererelevant.
ThetablebelowshowssomedataregardingAustralia’snursingemploymentandtotalworkforcein1987and.Summarizetheinformationbyselectingandreportingthemainfeatures,andmakecomparisonswhererelevant.
ThetablebelowshowsthepercentageofhouseholdswithvariouselectronicitemsinNewZealandin1995and.Summarizetheinformationbyselectingandreportingthemainfeatures,andmakecomparisonswhererelevant.
Thetablebelowshowstheaveragehourworkedbyfull-timeandpart-timeworkersaccordingtogenderinthreecountries.Summarizetheinformationbyselectingandreportingthemainfeatures,andmakecomparisonswhererelevant.
Thetablegivesinformationaboutthefemaleworkforceandfemalemanagersinfivecountries.Summarizetheinformationbyselectingandreportingthemainfeatures,andmakecomparisonswhererelevant.
Thetableshowstheresponsetothequestionnairegivenbytwogroupsofpeople(clubmembersandthegeneralpublic)whoshowedtheiropinionsaboutanewtheatre.Summarizetheinformationbyselectingandreportingthemainfeatures,andmakecomparisonswhererelevant.
Thetablebelowshowstheuseofthreeenergysource’sintheUK,theirworldreserveandhowmanyyearstheyareexpectedtolast.Summarizetheinformationbyselectingandreportingthemainfeatures,andmakecomparisonswhererelevant.
Thetableshowsthefoursocialandeconomicindicatorsinfourcountriesin.Summarizetheinformationbyselectingandreportingthemainfeatures,andmakecomparisonswhererelevant.
ThechartsshowthenumberofJapanesetouriststravelingabroadbetween1985and1995andAustralia’sshareoftheJapanesetouristmarket.Writeareportforauniversitylecturedescribingtheinformationshownbelow.
 升级会员
升级会员 