数字信号处理基于计算机的方法第三版matlab程序.docx
《数字信号处理基于计算机的方法第三版matlab程序.docx》由会员分享,可在线阅读,更多相关《数字信号处理基于计算机的方法第三版matlab程序.docx(23页珍藏版)》请在冰豆网上搜索。

数字信号处理基于计算机的方法第三版matlab程序
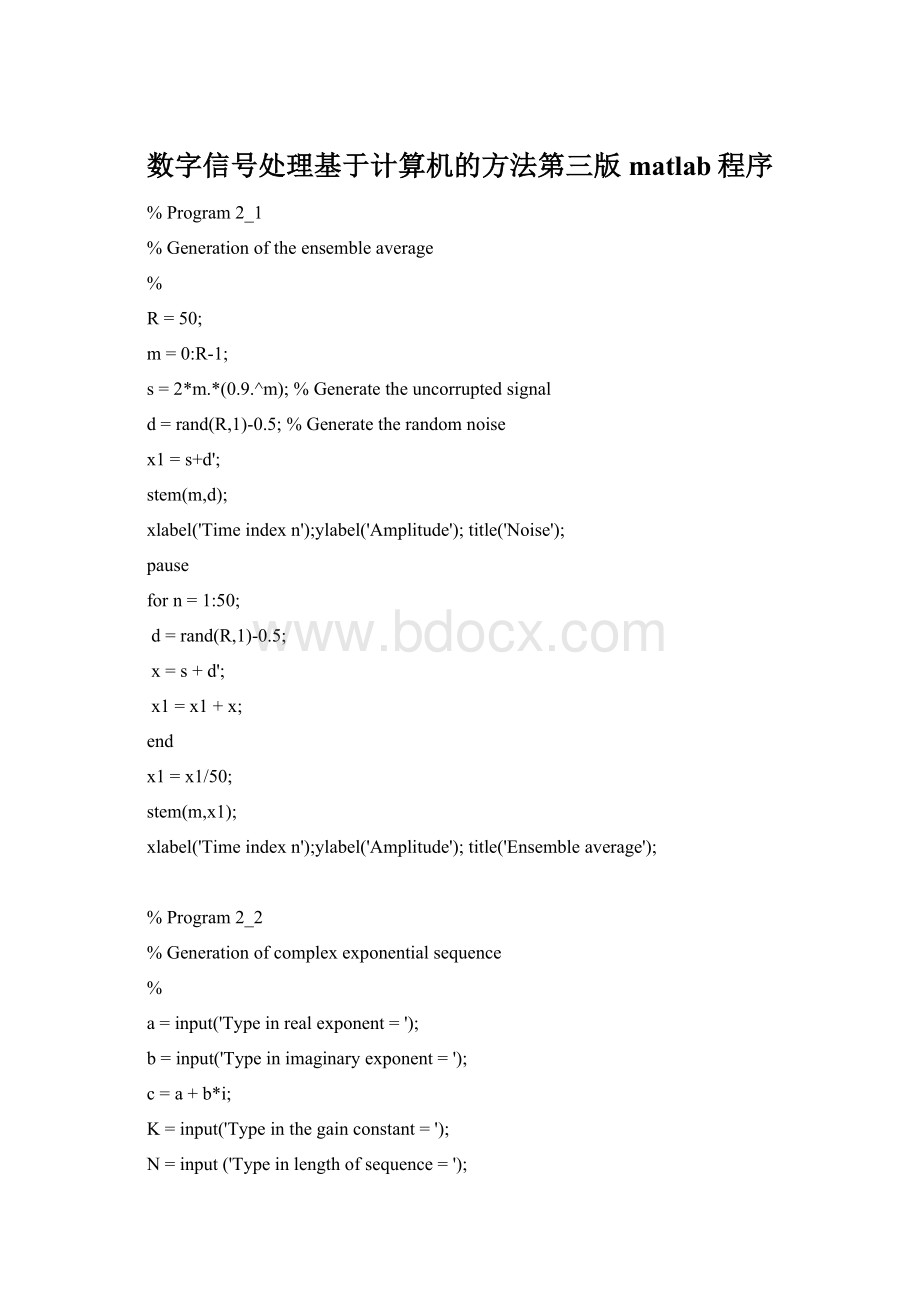
%Program2_1
%Generationoftheensembleaverage
%
R=50;
m=0:
R-1;
s=2*m.*(0.9.^m);%Generatetheuncorruptedsignal
d=rand(R,1)-0.5;%Generatetherandomnoise
x1=s+d';
stem(m,d);
xlabel('Timeindexn');ylabel('Amplitude');title('Noise');
pause
forn=1:
50;
d=rand(R,1)-0.5;
x=s+d';
x1=x1+x;
end
x1=x1/50;
stem(m,x1);
xlabel('Timeindexn');ylabel('Amplitude');title('Ensembleaverage');
%Program2_2
%Generationofcomplexexponentialsequence
%
a=input('Typeinrealexponent=');
b=input('Typeinimaginaryexponent=');
c=a+b*i;
K=input('Typeinthegainconstant=');
N=input('Typeinlengthofsequence=');
n=1:
N;
x=K*exp(c*n);%Generatethesequence
stem(n,real(x));%Plottherealpart
xlabel('Timeindexn');ylabel('Amplitude');
title('Realpart');
disp('PRESSRETURNforimaginarypart');
pause
stem(n,imag(x));%Plottheimaginarypart
xlabel('Timeindexn');ylabel('Amplitude');
title('Imaginarypart');
%Program2_3
%Generationofrealexponentialsequence
%
a=input('Typeinargument=');
K=input('Typeinthegainconstant=');
N=input('Typeinlengthofsequence=');
n=0:
N;
x=K*a.^n;
stem(n,x);
xlabel('Timeindexn');ylabel('Amplitude');
title(['\alpha=',num2str(a)]);
%Program2_4
%SignalSmoothingbyaMoving-AverageFilter
%
R=50;
d=rand(R,1)-0.5;
m=0:
1:
R-1;
s=2*m.*(0.9.^m);
x=s+d';
plot(m,d,'r-',m,s,'b--',m,x,'g:
')
xlabel('Timeindexn');ylabel('Amplitude')
legend('d[n]','s[n]','x[n]');
pause
M=input('Numberofinputsamples=');
b=ones(M,1)/M;
y=filter(b,1,x);
plot(m,s,'r-',m,y,'b--')
legend('s[n]','y[n]');
xlabel('Timeindexn');ylabel('Amplitude')
%Program2_5
%IllustrationofMedianFiltering
%
N=input('MedianFilterLength=');
R=50;a=rand(1,R)-0.4;
b=round(a);%Generateimpulsenoise
m=0:
R-1;
s=2*m.*(0.9.^m);%Generatesignal
x=s+b;%Impulsenoisecorruptedsignal
y=medfilt1(x,3);%Medianfiltering
subplot(2,1,1)
stem(m,x);axis([050-18]);
xlabel('n');ylabel('Amplitude');
title('ImpulseNoiseCorruptedSignal');
subplot(2,1,2)
stem(m,y);
xlabel('n');ylabel('Amplitude');
title('OutputofMedianFilter');
%Program2_6
%IllustrationofConvolution
%
a=input('Typeinthefirstsequence=');
b=input('Typeinthesecondsequence=');
c=conv(a,b);
M=length(c)-1;
n=0:
1:
M;
disp('outputsequence=');disp(c)
stem(n,c)
xlabel('Timeindexn');ylabel('Amplitude');
%Program2_7
%ComputationofCross-correlationSequence
%
x=input('Typeinthereferencesequence=');
y=input('Typeinthesecondsequence=');
%Computethecorrelationsequence
n1=length(y)-1;n2=length(x)-1;
r=conv(x,fliplr(y));
k=(-n1):
n2';
stem(k,r);
xlabel('Lagindex');ylabel('Amplitude');
v=axis;
axis([-n1n2v(3:
end)]);
%Program2_8
%ComputationofAutocorrelationofa
%NoiseCorruptedSinusoidalSequence
%
N=96;
n=1:
N;
x=cos(pi*0.25*n);%Generatethesinusoidalsequence
d=rand(1,N)-0.5;%Generatethenoisesequence
y=x+d;%Generatethenoise-corruptedsinusoidalsequence
r=conv(y,fliplr(y));%Computethecorrelationsequence
k=-28:
28;
stem(k,r(68:
124));
xlabel('Lagindex');ylabel('Amplitude');
%Program3_1
%Discrete-TimeFourierTransformComputation
%
%Readinthedesirednumberoffrequencysamples
k=input('Numberoffrequencypoints=');
%Readinthenumeratoranddenominatorcoefficients
num=input('Numeratorcoefficients=');
den=input('Denominatorcoefficients=');
%Computethefrequencyresponse
w=0:
pi/(k-1):
pi;
h=freqz(num,den,w);
%Plotthefrequencyresponse
subplot(2,2,1)
plot(w/pi,real(h));grid
title('Realpart')
xlabel('\omega/\pi');ylabel('Amplitude')
subplot(2,2,2)
plot(w/pi,imag(h));grid
title('Imaginarypart')
xlabel('\omega/\pi');ylabel('Amplitude')
subplot(2,2,3)
plot(w/pi,abs(h));grid
title('MagnitudeSpectrum')
xlabel('\omega/\pi');ylabel('Magnitude')
subplot(2,2,4)
plot(w/pi,angle(h));grid
title('PhaseSpectrum')
xlabel('\omega/\pi');ylabel('Phase,radians')
%Program3_2
%Generatethefiltercoefficients
h1=ones(1,5)/5;h2=ones(1,14)/14;
%Computethefrequencyresponses
[H1,w]=freqz(h1,1,256);
[H2,w]=freqz(h2,1,256);
%Computeandplotthemagnituderesponses
m1=abs(H1);m2=abs(H2);
plot(w/pi,m1,'r-',w/pi,m2,'b--');
ylabel('Magnitude');xlabel('\omega/\pi');
legend('M=5','M=14');
pause
%Computeandplotthephaseresponses
ph1=angle(H1)*180/pi;ph2=angle(H2)*180/pi;
plot(w/pi,ph1,w/pi,ph2);
ylabel('Phase,degrees');xlabel('\omega/\pi');
legend('M=5','M=14');
%Program3_3
%Setupthefiltercoefficients
b=[-6.7619513.456335-6.76195];
%Setinitialconditionstozerovalues
zi=[00];
%Generatethetwosinusoidalsequences
n=0:
99;
x1=cos(0.1*n);
x2=cos(0.4*n);
%Generatethefilteroutputsequence
y=filter(b,1,x1+x2,zi);
%Plottheinputandtheoutputsequences
plot(n,y,'r-',n,x2,'b--',n,x1,'g-.');grid
axis([0100-1.24]);
ylabel('Amplitude');xlabel('Timeindexn');
legend('y[n]','x2[n]','x1[n]')
%Program4_1
%4-thOrderAnalogButterworthLowpassFilterDesign
%
formatlong
%Determinezerosandpoles
[z,p,k]=buttap(4);
disp('Polesareat');disp(p);
%Determinetransferfunctioncoefficients
[pz,pp]=zp2tf(z,p,k);
%Printcoefficientsindescendingpowersofs
disp('Numeratorpolynomial');disp(pz)
disp('Denominatorpolynomial');disp(real(pp))
omega=[0:
0.01:
5];
%Computeandplotfrequencyresponse
h=freqs(pz,pp,omega);
plot(omega,20*log10(abs(h)));grid
xlabel('Normalizedfrequency');ylabel('Gain,dB');
%Program4_2
%ProgramtoDesignButterworthLowpassFilter
%
%Typeinthefilterorderandpassbandedgefrequency
N=input('Typeinfilterorder=');
Wn=input('3-dBcutoffangularfrequency=');
%Determinethetransferfunction
[num,den]=butter(N,Wn,'s');
%Computeandplotthefrequencyresponse
omega=[0:
200:
12000*pi];
h=freqs(num,den,omega);
plot(omega/(2*pi),20*log10(abs(h)));
xlabel('Frequency,Hz');ylabel('Gain,dB');
%Program4_3
%ProgramtoDesignType1ChebyshevLowpassFilter
%
%Readinthefilterorder,passbandedgefrequency
%andpassbandrippleindB
N=input('Order=');
Fp=input('PassbandedgefrequencyinHz=');
Rp=input('PassbandrippleindB=');
%Determinethecoefficientsofthetransferfunction
[num,den]=cheby1(N,Rp,2*pi*Fp,'s');
%Computeandplotthefrequencyresponse
omega=[0:
200:
12000*pi];
h=freqs(num,den,omega);
plot(omega/(2*pi),20*log10(abs(h)));
xlabel('Frequency,Hz');ylabel('Gain,dB');
%Program4_4
%ProgramtoDesignEllipticLowpassFilter
%
%Readinthefilterorder,passbandedgefrequency,
%passbandrippleindBandminimumstopband
%attenuationindB
N=input('Order=');
Fp=input('PassbandedgefrequencyinHz=');
Rp=input('PassbandrippleindB=');
Rs=input('MinimumstopbandattenuationindB=');
%Determinethecoefficientsofthetransferfunction
[num,den]=ellip(N,Rp,Rs,2*pi*Fp,'s');
%Computeandplotthefrequencyresponse
omega=[0:
200:
12000*pi];
h=freqs(num,den,omega);
plot(omega/(2*pi),20*log10(abs(h)));
xlabel('Frequency,Hz');ylabel('Gain,dB');
functiony=circonv(x1,x2)
%Developsasequenceyobtainedbythecircular
%convolutionoftwoequal-lengthsequencesx1andx2
L1=length(x1);
L2=length(x2);
ifL1~=L2,error('Sequencesofunequallength'),end
y=zeros(1,L1);
x2tr=[x2
(1)x2(L2:
-1:
2)];
fork=1:
L1,
sh=circshift(x2tr',k-1)';
h=x1.*sh;
disp(sh);
y(k)=sum(h);
end
function[Y]=haar_1D(X)
%ComputestheHaartransformoftheinputvectorX
%ThelengthofXmustbeapower-of-2
%RecursivelybuildstheHaarmatrixH
v=log2(length(X))-1;
H=[11;1-1];
form=1:
v,
A=[kron(H,[11]);
2^(m/2).*kron(eye(2^m),[1-1])];
H=A;
end
Y=H*double(X(:
));
%Program5_1
%IllustrationofDFTComputation
%
%ReadinthelengthNofsequenceandthedesired
%lengthMoftheDFT
N=input('Typeinthelengthofthesequence=');
M=input('TypeinthelengthoftheDFT=');
%Generatethelength-Ntime-domainsequence
u=[ones(1,N)];
%ComputeitsM-pointDFT
U=fft(u,M);
%Plotthetime-domainsequenceanditsDFT
t=0:
1:
N-1;
stem(t,u)
title('Originaltime-domainsequence')
xlabel('Timeindexn');ylabel('Amplitude')
pause
subplot(2,1,1)
k=0:
1:
M-1;
stem(k,abs(U))
title('MagnitudeoftheDFTsamples')
xlabel('Frequencyindexk');ylabel('Magnitude')
subplot(2,1,2)
stem(k,angle(U))
title('PhaseoftheDFTsamples')
xlabel('Frequencyindexk');ylabel('Phase')
%Program5_2
%IllustrationofIDFTComputation
%
%ReadinthelengthKoftheDFTandthedesired
%lengthNoftheIDFT
K=input('TypeinthelengthoftheDFT=');
N=input('TypeinthelengthoftheIDFT=');
%Generatethelength-KDFTsequence
k=0:
K-1;
V=k/K;
%ComputeitsN-pointIDFT
v=ifft(V,N);
%PlottheDFTanditsIDFT
stem(k,V)
xlabel('Frequencyindexk');ylabel('Amplitude')
title('OriginalDFTsamples')
pause
subplot(2,1,1)
n=0:
N-1;
stem(n,real(v))
title('Realpartofthetime-domainsamples')
xlabel('Timeindexn');ylabel('Amplitude')
subplot(2,1,2)
stem(n,imag(v))
title('Imaginarypartofthetime-domainsamples')
xlabel('Timeindexn');ylabel('Amplitude')
%Program5_3
%NumericalComputationofFouriertransformUsingDFT