《基于MATLAB的信号与系统实验指导》编程练习.docx
《《基于MATLAB的信号与系统实验指导》编程练习.docx》由会员分享,可在线阅读,更多相关《《基于MATLAB的信号与系统实验指导》编程练习.docx(45页珍藏版)》请在冰豆网上搜索。
《基于MATLAB的信号与系统实验指导》编程练习
2连续时间信号在MATLAB中的表示
2-1.利用MATLAB命令画出下列连续信号的波形图
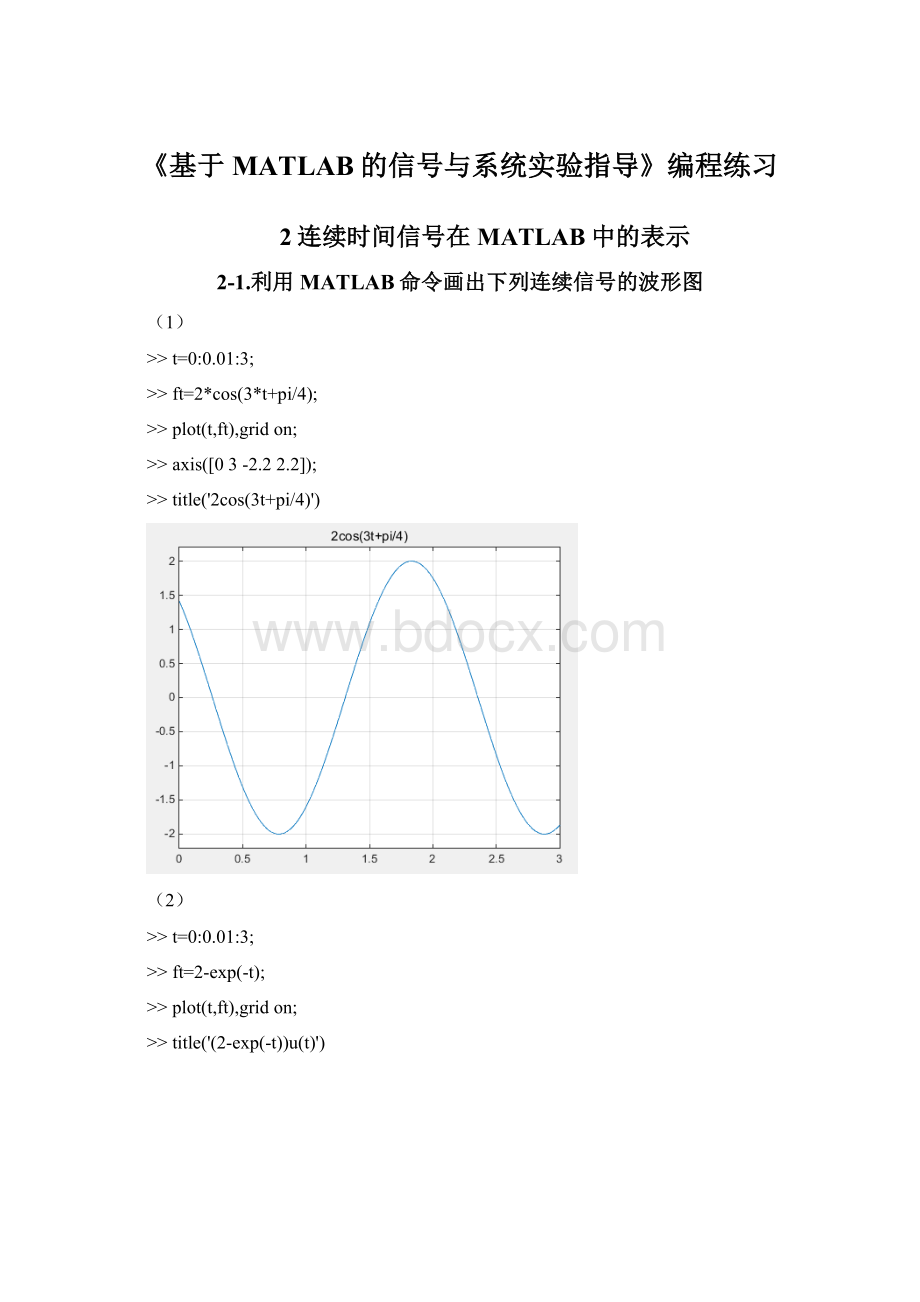
(1)
>>t=0:
0.01:
3;
>>ft=2*cos(3*t+pi/4);
>>plot(t,ft),gridon;
>>axis([03-2.22.2]);
>>title('2cos(3t+pi/4)')
(2)
>>t=0:
0.01:
3;
>>ft=2-exp(-t);
>>plot(t,ft),gridon;
>>title('(2-exp(-t))u(t)')
(3)
>>t=-1:
0.01:
1;
>>ft=t.*(uCT(t)-uCT(t-1));
>>plot(t,ft),gridon
>>axis([-11-0.21.2]);
>>title('t[u(t)-u(t-1)]')
(4)
>>t=-1:
0.01:
3;
>>ft=(1+cos(pi*t)).*(uCT(t)-uCT(t-2));
>>plot(t,ft),gridon
>>axis([-13-0.22.2]);
>>title('[1+cos(pi*t)][u(t)-u(t-2)]')
2-2.利用MATLAB命令画出下列复信号的实部、虚部、模和辐角
(1)
>>t=0:
0.01:
3;
>>ft=2+exp(i*(pi/4)*t)+exp(i*(pi/2)*t);
>>subplot(2,2,1);plot(t,real(ft));title('实部');axis([0304]);gridon;
>>subplot(2,2,2);plot(t,imag(ft));title('虚部');axis([0302]);gridon;
>>subplot(2,2,3);plot(t,abs(ft));title('模');axis([0304]);gridon;
>>subplot(2,2,4);plot(t,angle(ft));title('相角');axis([0302]);gridon;
(2)
t=0:
0.01:
3;
>>ft=2*exp(i*(t+pi/4));
>>subplot(2,2,1);plot(t,real(ft));title('实部');axis([0302]);gridon;
>>subplot(2,2,2);plot(t,imag(ft));title('虚部');axis([0302]);gridon;
>>subplot(2,2,3);plot(t,abs(ft));title('模');axis([0304]);gridon;
>>subplot(2,2,4);plot(t,angle(ft));title('相角');axis([0304]);gridon;
2-3.利用MATLAB命令产生幅度为1、周期为1、占空比为0.5的一个周期矩形脉冲信号
>>t=-0.5:
0.01:
3;
>>ft=square(2*pi*t,50);
>>plot(t,ft);gridon;axis([-0.53-1.21.2]);
>>title('幅度为1、周期为1、占空比0.5的周期举行脉冲信号')
3连续时间信号在MATLAB中的运算
3-1.试用MATLAB命令绘出以下信号的波形图
(1)
>>symsxt;
>>t=-1:
0.01:
1;
>>x=exp(-t).*sin(10*pi*t)+exp(-0.5*t).*sin(9*pi*t);
>>plot(t,x)
(2)
>>symsxt;
>>t=-1:
0.01:
1;
>>x=sinc(t).*cos(10*pi*t);
>>plot(t,x)
3-2.已知连续时间信号f(t)的波形如图3-6所示,试用MATLAB命令画出下列信号的波形图
先画出图3-6:
>>t=-2:
0.01:
2;
>>f=(-t-1).*(-uCT(t+2)+uCT(t+1))+uCT(t+1)+uCT(t)-uCT(t-1)-(t-1).*(uCT(t-1)-uCT(t-2))-uCT(t-2);
>>plot(t,f)
>>axis([-44-12])
>>title('图3-6')
>>t=-2:
0.01:
2;
>>f1=funct2(t-1);
>>f2=funct2(2-t);
>>f3=funct2(2*t+1);
>>f4=funct2(4-t/2);
>>f5=(funct2(t)+funct2(-t)).*uCT(t);
>>subplot(231);plot(t,f1);gridon;title('f(t-1)');axis([-33-12]);
>>subplot(232);plot(t,f2);gridon;title('f(2-t)');axis([-33-12]);
>>subplot(233);plot(t,f3);gridon;title('f(2t-1)');axis([-33-12]);
>>subplot(234);plot(t,f4);gridon;title('f(4-t/2)');axis([-33-12]);
>>subplot(235);plot(t,f5);gridon;title('(f(t)+f(-t))u(t)');axis([-33-12]);
3-3.试用MATLAB命令绘出如图3-7所示信号的偶分量和奇分量
>>t=0:
0.01:
2;
>>f=(uCT(t)-uCT(t-2)).*(-t+1);
>>plot(t,f);title('图3-7')
>>f1=fliplr(f);
>>fe=(f+f1)/2;fo=(f-f1)/2;
>>subplot(211),plot(t,fe);gridon
>>title('fe')
>>subplot(212),plot(t,fo);gridon;title('fo')
4连续时间信号的卷积计算
4-1用MATLAB命令绘出下列信号的卷积积分
的时域波形图
>>dt=0.001;t1=-0.5:
dt:
3.5;
>>f1=uCT(t1)-uCT(t1-2);
>>t2=t1;
>>f2=uCT(t2)+uCT(t2-1)-uCT(t2-2)-uCT(t2-3);
>>[t,f]=ctsconv(f1,f2,t1,t2,dt);
6周期信号的傅里叶级数及频谱分析
6-1已知周期三角信号如图6-5所示,试求出该信号的傅里叶级数,利用MATLAB编程实现其各次谐波的叠加,并验证其收敛性。
6-2试用MATLAB分析图6-5中周期三角信号的频谱。
当周期三角信号的周期和三角信号的宽度变化时,试观察分析其频谱的变化。
7傅里叶变换及其性质
7-1试用MATLAB命令求下列信号的傅里叶变换,并绘出其幅度谱和相位谱。
(1)
(2)
解:
(1)ft1=sym('sin(2*pi*(t-1))/(pi*(t-1))');
>>Fw1=simplify(fourier(ft1));
>>subplot(211)
>>ezplot(abs(Fw1)),gridon
>>title('幅度谱')
>>phase=atan(imag(Fw1)/real(Fw1));
>>subplot(212)
>>ezplot(phase);gridon
>>title('相位谱')
(2)
7-2.试用MATLAB命令求下列信号的傅里叶反变换,并绘出其时域信号图。
(1)
(2)
解:
(1)>>symst
>>Fw=sym('10/(3+w*i)-4/(5+w*i)');
>>ft=ifourier(Fw,t);
>>ezplot(ft),gridon
(2)>>symst
>>Fw2=sym('exp(-4*w^2)');
>>ft2=ifourier(Fw2,t)
ft2=
exp(-t^2/16)/(4*pi^(1/2))
3.试用MATLAB数值计算方法求图7-8所示信号的傅里叶变换,并画出其频谱图。
解:
4.已知两个门信号的卷积为三角波信号,试用MATLAB命令验证傅里叶变换的时域卷积定理。
解:
将门函数先进行时域卷积运算,再将卷积后的结果做傅里叶变换,程序和结果如下:
dt = 0.01; t = -2:
dt:
2.5;
f1 = uCT(t+0.5)- uCT(t-0.5);
f = conv(f1,f1)*dt;
ft=sym('f');
Fw = fourier(ft)
Fw =2*i*pi*dirac(1,w)
将一个门函数先进行傅里叶变换,再将结果与自身相乘,程序和结果如下:
dt = 0.01; t = -2:
dt:
2.5;
f1 = uCT(t+0.5)- uCT(t-0.5);
ft=sym('f1');
Fw = fourier(ft);
Fw=Fw*Fw
Fw =-4*pi^2*dirac(1,w)^2
由此来验证傅里叶变换的时域卷积定理
第8章连续时间LTI系统的频率特性及频域分析
8.1试用MATLAB命令求图8-8所示电路系统的幅频特性和相频特性。
已知R=10Ω,L=2H,C=0.1F
解:
由电路知识可得,该电路系统的频率响应为
MATLAB源程序:
>>w=-6*pi:
0.01:
6*pi;
>>b=[10];
>>a=[0.20.210];
>>H=freqs(b,a,w);
>>subplot(211)
>>plot(w,abs(H)),gridon
>>xlabel('\omega(rad/s)'),ylabel('|H(\omega)|')
>>title('电路系统的幅频特性')
>>subplot(212)
>>plot(w,angle(H)),gridon
>>xlabel('\omega(rad/s)'),ylabel('\phi(\omega)')
>>title('电路系统的相频特性')
8.2已知系统微分方程和激励信号如下,试用MATLAB命令求系统的稳态响应。
(1)
,
;
(2)
,
。
解:
(1)频率响应为
>>t=0:
0.01:
20;
>>H=(w*i)/(w*i+3/2);
>>f=cos(2*t);
>>y=abs(H)*cos(2*t+angle(H));
>>subplot(211)
>>plot(t,f),gridon
>>ylabel('f(t)'),xlabel('Time(s)')
>>title('激励信号的波形')
>>subplot(212)
>>plot(t,y),gridon
>>ylabel('y(t)'),xlabel('Time(s)')
>>title('稳态响应的波形')
(2)频率响应为
MATLAB源程序:
>>t=0:
0.01:
20;
>>w1=2;w2=5;
>>H1=((-i*w1+2)./((i*w1)^2+2*i*w1+3));
>>H2=(-i*w2+2)./((i*w2)^2+2*i*w2+3);
>>f=3+cos(2*t)+cos(5*t);
>>y=3+abs(H1)*cos(w1*t+angle(H1))+abs(H2)*cos(w2*t+angle(H2));
>>subplot(211);
>>plot(t,f);gridon
>>ylabel('f(t)'),xlabel('Time(s)')
>>title('激励信号的波形')
>>subplot(212);
>>plot(t,y),gridon
>>ylabel('y(t)'),xlabel('Time(s)')
>>title('稳态响应的波形')
第9章信号抽样及抽样定理
9.1设有三个不同频率的正弦信号,频率分别为f1=100Hz,f2=200Hz,f3=3800Hz。
现在用抽样频率fs=4000Hz对这三个正弦信号进行抽样,用MATLAB命令画出各抽样信号的波形及其频谱,并分析其频率混叠现象。
解:
>>Ts=0.00025;
>>dt=0.0001;
>>t1=-0.1:
dt:
0.1;
>>ft=sin(200*pi*t1);
>>subplot(221)
>>plot(t1,ft),gridon
>>axis([-0.010.01-1.11.1])
>>xlabel('Time(sec)'),ylabel('f(t)')
>>title('f1信号')
>>N=100;
>>k=-N:
N;
>>W=pi*k/(N*dt);
>>Fw=ft*exp(-i*t1'*W)*dt;
>>subplot(222)
>>plot(W,abs(Fw)),gridon
>>axis([-50005000-0.10.2])
>>t2=-0.1:
Ts:
0.1;
>>fst=sin(200*pi*t2);
>>subplot(223)
>>plot(t1,ft,':
'),holdon
>>stem(t2,fst),gridon
>>axis([-0.010.01-1.11.1])
>>xlabel('Time(sec)'),ylabel('fs(t)')
>>title('抽样后的信号'),holdoff
>>Fsw=fst*exp(-i*t2'*W)*Ts;
>>subplot(224)
>>plot(W,abs(Fsw)),gridon
>>axis([-50005000-0.10.2])
>>xlabel('\omega'),ylabel('Fs(w)')
>>title('抽样信号的频谱')
9.2结合抽样定理,用MATLAB编程实现Sa(t)信号经冲激脉冲抽样后得到的抽样信号fs(t)及其频谱,并利用fs(t)重构Sa(t)信号。
解:
首先,画出Sa(t)信号的波形和频谱:
>>symst;
>>Sa(t)=(sin(t))/t;
>>subplot(211)
>>ezplot(Sa(t)),gridon
>>xlabel('Time(sec)'),ylabel('Sa(t)')
>>title('Sa(t)的波形')
>>Fw=simplify(fourier(Sa(t)));
>>subplot(212)
>>ezplot(abs(Sa(t))),gridon
>>xlabel('\omega'),ylabel('H(jw)')
>>title('Sa(t)的频谱')
由图可知,Sa(t)的频谱大部分集中在[0,6]之间,设其截止频率为
,因而奈奎斯特间隔
,采用截止频率
的低通滤波器对抽样信号滤波后重建信号
,并计算重建信号与原Sa(t)信号的绝对误差:
>>wm=6;
>>wc=1.2*wm;
>>Ts=0.4;
>>n=-100:
100;
>>nTs=n*Ts;
>>fs=sinc(nTs/pi);
>>t=-6:
0.1:
6;
>>ft=Ts*wc/pi*fs*sinc((wc/pi)*(ones(length(nTs),1)*t-nTs'*ones(1,length(t))));
>>t1=-6:
0.1:
6;
>>f1=sinc(t1/pi);
>>subplot(311)
>>plot(t1,f1,':
'),holdon
>>stem(nTs,fs),gridon
>>axis([-66-0.51])
>>xlabel('nTs'),ylabel('f(nTs)');
>>title('抽样间隔Ts=0.4时的抽样信号f(nTs)')
>>holdoff
>>subplot(312)
>>plot(t,ft),gridon
>>axis([-66-0.51])
>>xlabel('t'),ylabel('f(t)');
>>title('由f(nTs)信号重建得到Sa(t)信号')
>>error=abs(ft-f1);
>>subplot(313)
>>plot(t,error),gridon
>>xlabel('t'),ylabel('error(t)');
>>title('重建信号与原信号的绝对误差')
第10章拉普拉斯变换
10.1试用MATLAB命令求下列函数的拉普拉斯变换。
(1)
(2)
解:
(1)>>f=sym('t*exp(-3*t)');
>>L=laplace(f)
L=
1/(s+3)^2
(2)>>f=sym('(1+3*t+5*t^2)*exp(-2*t)');
>>L=laplace(f)
L=
1/(s+2)+3/(s+2)^2+10/(s+2)^3
10.2试用MATLAB命令求下列函数的拉普拉斯反变换。
(1)
(2)
(3)
(4)
解:
(1)>>F=sym('1/(2*s+3)');
>>f=ilaplace(F)
f=
exp(-(3*t)/2)/2
(2)>>F=sym('3/((s+5)*(s+2))');
>>f=ilaplace(F)
f=
exp(-2*t)-exp(-5*t)
(3)>>F=sym('3*s/((s+5)*(s+2))');
>>f=ilaplace(F)
f=
5*exp(-5*t)-2*exp(-2*t)
(4)>>F=sym('1/(s^2*(s^2+2*s+2))');
>>f=ilaplace(F)
f=
t/2+(exp(-t)*cos(t))/2-1/2
10.3已知某线性时不变系统的系统函数为
利用MATLAB的拉普拉斯变换法求系统的单位阶跃响应。
解:
输入信号
的拉普拉斯变换为
,故
>>F=sym('(4*s^2+4*s+4)/(s^4+3*s^3+2*s^2)');
>>f=ilaplace(F)
f=
2*t+4*exp(-t)-3*exp(-2*t)-1
所以单位阶跃响应为
.
第11章连续时间LTI系统的零极点分析
11.1试用MATLAB命令画出下列系统函数的零极点分布图,并判断其稳定性。
(1)
(2)
(3)
(4)
(5)
解:
(1)>>b=[120];
>>a=[108];
>>sys=tf(b,a)
>>pzmap(sys)
因为极点在虚轴上,所以系统临界稳定。
(2)>>b=[1-20];
>>a=[108];
>>sys=tf(b,a);
>>pzmap(sys)
系统临界稳定。
(3)>>b=[100];
>>a=[148];
>>sys=tf(b,a);
>>pzmap(sys)
系统稳定。
(4)>>b=[100];
>>a=[1-48];
>>sys=tf(b,a);
>>pzmap(sys)
系统不稳定。
(5)>>b=[10];
>>a=[1-480];
>>sys=tf(b,a);
>>pzmap(sys)
系统不稳定。
11.2试用MATLAB命令实现下列含有二阶极点的系统函数所对应的时域冲击响应的波形,并分析系统函数对时域波形的影响。
(1)
(2)
(3)
解:
(1)>>b1=[1];
>>a1=[100];
>>sys1=tf(b1,a1);
>>subplot(121)
>>pzmap(sys1)
>>subplot(122)
>>impulse(b1,a1)
系统在虚轴上有二阶极点,系统不稳定。
(2)>>b2=[1];
>>a2=[121];
>>sys2=tf(b2,a2);
>>subplot(121)
>>pzmap(sys2)
ROC为Re{s}>-1,系统稳定。
(3)>>b3=[140];
>>a3=[109802401];
>>sys3=tf(b3,a3);
>>subplot(121)
>>pzmap(sys3)
>>subplot(122)
>>impulse(b3,a3)
>>axis([010-2020])
s右半平面有极点,系统不稳定。
11.3已知系统函数为
,试用MATLAB画出a=0、
、1、2时系统的零极点分布图。
如果系统是稳定的,画出系统的幅频特性曲线,并分析系统极点位置对系统的幅频特性有何影响?
(提示:
利用freqs函数。
)
解:
(1)a=0时:
>>b1=[1];
>>a1=[101];
>>sys1=tf(b1,a1);
>>pzmap(sys1)
系统是不稳定的。
(2)a=
时:
>>b2=[1];
>>a2=[10.51];
>>sys2=tf(b2,a2);
>>subplot(121)
>>pzmap(sys2)
>>w=-8*pi:
0.01:
8*pi;
>>H=freqs(b2,a2,w)
>>subplot(122)
>>plot(w,abs(H)),gridon
>>plot(w,abs(H)),gridon
>>xlabel('\omega(rad/s)'),ylabel('|H(\omega)|')
>>axis([-101002.5])
>>title('H(s)=1/(s^2+0.5s+1)的幅频特性')
(3)a=1时:
>>b3=[1];
>>a3=[121];
>>sys3=tf(b3,a3);
>>subplot(121)
>>pzmap(sys3)
>>w=-8*pi:
0.01:
8*pi;
>>H=freqs(b3,a3,w);
>>subplot(122)
>>plot(w,abs(H)),gridon
>>xlabel('\omega(rad/s)'),ylabel('|H(\omega)|')
>>title('H(s)=1/(s^2+2s+1)的幅频特性')
(4)a=2时:
>>b4=[1];
>>a4=[141];
>>sys4=tf(b4,a4);
>>subplot(121)
>>
 升级会员
升级会员 