完整word版考官Simon雅思小作文范文22篇.docx
《完整word版考官Simon雅思小作文范文22篇.docx》由会员分享,可在线阅读,更多相关《完整word版考官Simon雅思小作文范文22篇.docx(22页珍藏版)》请在冰豆网上搜索。
完整word版考官Simon雅思小作文范文22篇
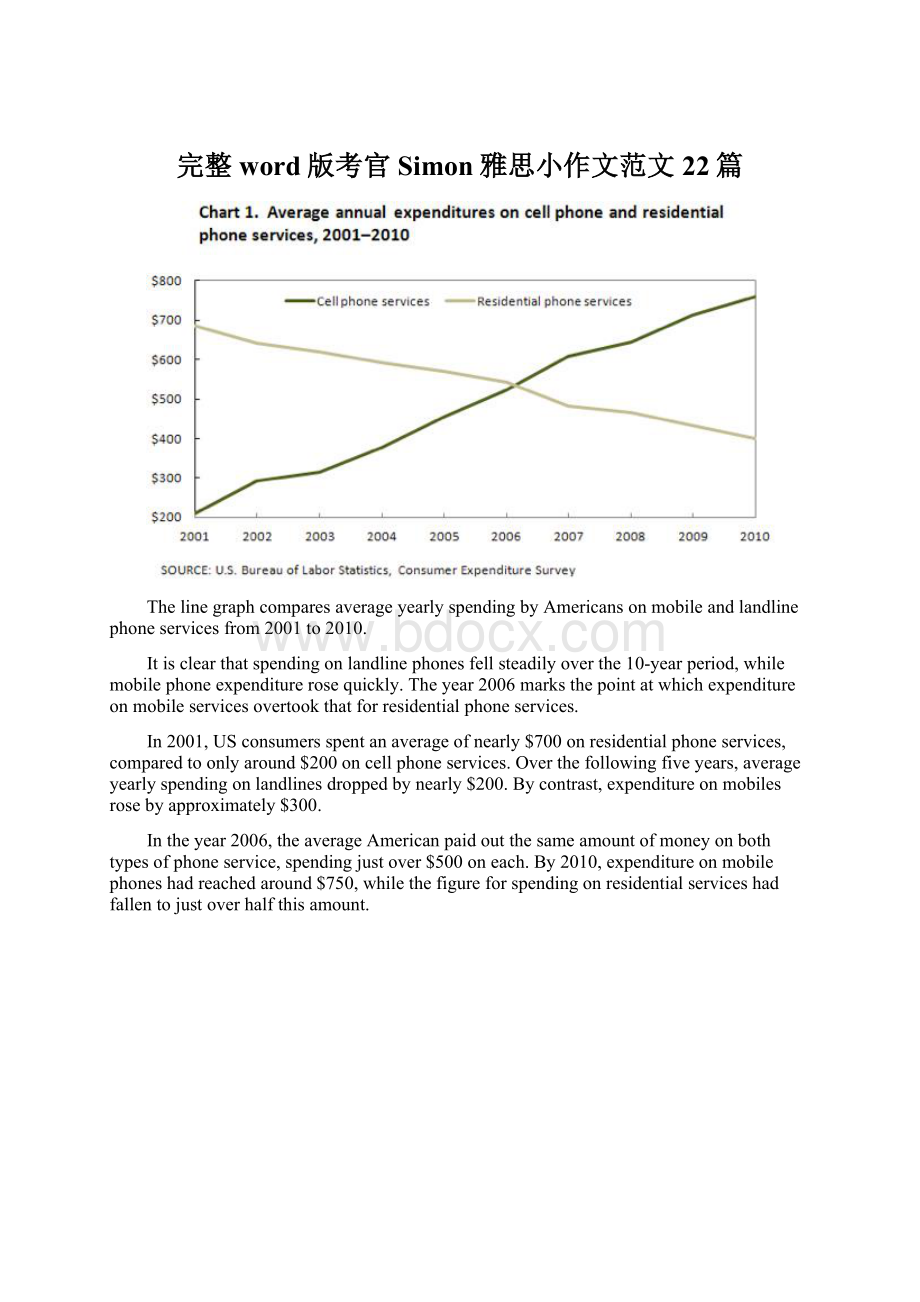
ThelinegraphcomparesaverageyearlyspendingbyAmericansonmobileandlandlinephoneservicesfrom2001to2010.
Itisclearthatspendingonlandlinephonesfellsteadilyoverthe10-yearperiod,whilemobilephoneexpenditurerosequickly.Theyear2006marksthepointatwhichexpenditureonmobileservicesovertookthatforresidentialphoneservices.
In2001,USconsumersspentanaverageofnearly$700onresidentialphoneservices,comparedtoonlyaround$200oncellphoneservices.Overthefollowingfiveyears,averageyearlyspendingonlandlinesdroppedbynearly$200.Bycontrast,expenditureonmobilesrosebyapproximately$300.
Intheyear2006,theaverageAmericanpaidoutthesameamountofmoneyonbothtypesofphoneservice,spendingjustover$500oneach.By2010,expenditureonmobilephoneshadreachedaround$750,whilethefigureforspendingonresidentialserviceshadfallentojustoverhalfthisamount.
Thediagramillustratesthevariousstagesinthelifeofahoneybee.Wecanseethatthecompletelifecyclelastsbetween34and36days.Itisalsonoticeablethattherearefivemainstagesinthedevelopmentofthehoneybee,fromeggtomatureadultinsect.
Thelifecycleofthehoneybeebeginswhenthefemaleadultlaysanegg;thefemaletypicallylaysoneortwoeggsevery3days.Between9and10dayslater,eachegghatchesandtheimmatureinsect,ornymph,appears.
Duringthethirdstageofthelifecycle,thenymphgrowsinsizeandshedsitsskinthreetimes.Thismoultingfirsttakesplace5daysaftertheegghatches,then7dayslater,andagainanother9dayslater.Afteratotalof30to31daysfromthestartofthecycle,theyoungadulthoneybeeemergesfromitsfinalmoultingstage,andinthespaceofonly4daysitreachesfullmaturity.
(169words,band9)
ThechartcomparesaveragefiguresfortemperatureandprecipitationoverthecourseofacalendaryearinKolkata.
ItisnoticeablethatmonthlyfiguresforprecipitationinKolkatavaryconsiderably,whereasmonthlytemperaturesremainrelativelystable.RainfallishighestfromJulytoAugust,whiletemperaturesarehighestinAprilandMay.
BetweenthemonthsofJanuaryandMay,averagetemperaturesinKolkatarisefromtheirlowestpointataround20°Ctoapeakofjustover30°C.Averagerainfallinthecityalsorisesoverthesameperiod,fromapproximately20mmofraininJanuaryto100mminMay.
Whiletemperaturesstayroughlythesameforthenextfourmonths,theamountofrainfallmorethandoublesbetweenMayandJune.Figuresforprecipitationremainabove250mmfromJunetoSeptember,peakingataround330mminJuly.Thefinalthreemonthsoftheyearseeadramaticfallinprecipitation,toalowofabout10mminDecember,andasteadydropintemperaturesbacktotheJanuaryaverage.
(173words,band9)
PostedbySimoninIELTS
Thebarchartscomparestudentsofdifferentagesintermsofwhytheyarestudyingandwhethertheyaresupportedbyanemployer.
Itisclearthattheproportionofstudentswhostudyforcareerpurposesisfarhigheramongtheyoungeragegroups,whiletheoldeststudentsaremorelikelytostudyforinterest.Employersupportismorecommonlygiventoyoungerstudents.
Around80%ofstudentsagedunder26studytofurthertheircareers,whereasonly10%studypurelyoutofinterest.Thegapbetweenthesetwoproportionsnarrowsasstudentsgetolder,andthefiguresforthoseintheirfortiesarethesame,atabout40%.Studentsagedover49overwhelminglystudyforinterest(70%)ratherthanforprofessionalreasons(lessthan20%).
Justover60%ofstudentsagedunder26aresupportedbytheiremployers.Bycontrast,the30-39agegroupisthemostself-sufficient,withonly30%beinggiventimeoffandhelpwithfees.Thefiguresriseslightlyforstudentsintheirfortiesandforthoseaged50ormore.
(178words,band9)
Thebarchartcomparesthenumberofincidentsandinjuriesforevery100millionpassengermilestravelledonfivedifferenttypesofpublictransportin2002.
Itisclearthatthemostincidentsandinjuriestookplaceondemand-responsevehicles.Bycontrast,commuterrailservicesrecordedbyfarthelowestfigures.
Atotalof225incidentsand173injuries,per100millionpassengermilestravelled,tookplaceondemand-responsetransportservices.Thesefigureswerenearlythreetimesashighasthoseforthesecondhighestcategory,busservices.Therewere76incidentsand66peoplewereinjuredonbuses.
Railservicesexperiencedfewerproblems.Thenumberofincidentsonlightrailtrainsequalledthefigurerecordedforbuses,butthereweresignificantlyfewerinjuries,atonly39.Heavyrailservicessawlowernumbersofsucheventsthanlightrailservices,butcommuterrailpassengerswereevenlesslikelytoexperienceproblems.Infact,only20incidentsand17injuriesoccurredoncommutertrains.
(165words,band9)
Thelinegraphcomparesthepercentageofpeopleaged65ormoreinthreecountriesoveraperiodof100years.
Itisclearthattheproportionofelderlypeopleincreasesineachcountrybetween1940and2040.Japanisexpectedtoseethemostdramaticchangesinitselderlypopulation.
In1940,around9%ofAmericanswereaged65orover,comparedtoabout7%ofSwedishpeopleand5%ofJapanesepeople.TheproportionsofelderlypeopleintheUSAandSwedenrosegraduallyoverthenext50years,reachingjustunder15%in1990.Bycontrast,thefiguresforJapanremainedbelow5%untiltheearly2000s.
Lookingintothefuture,asuddenincreaseinthepercentageofelderlypeopleispredictedforJapan,withajumpofover15%injust10yearsfrom2030to2040.By2040,itisthoughtthataround27%oftheJapanesepopulationwillbe65yearsoldormore,whilethefiguresforSwedenandtheUSAwillbeslightlylower,atabout25%and23%respectively.
(178words,band9)
Thetableshowspercentagesofconsumerexpenditureforthreecategoriesofproductsandservicesinfivecountriesin2002.
Itisclearthatthelargestproportionofconsumerspendingineachcountrywentonfood,drinksandtobacco.Ontheotherhand,theleisure/educationcategoryhasthelowestpercentagesinthetable.
Outofthefivecountries,consumerspendingonfood,drinksandtobaccowasnoticeablyhigherinTurkey,at32.14%,andIreland,atnearly29%.TheproportionofspendingonleisureandeducationwasalsohighestinTurkey,at4.35%,whileexpenditureonclothingandfootwearwassignificantlyhigherinItaly,at9%,thaninanyoftheothercountries.
ItcanbeseenthatSwedenhadthelowestpercentagesofnationalconsumerexpenditureforfood/drinks/tobaccoandforclothing/footwear,atnearly16%andjustover5%respectively.Spainhadslightlyhigherfiguresforthesecategories,butthelowestfigureforleisure/education,atonly1.98%.
Thechartscomparetheamountofwaterusedforagriculture,industryandhomesaroundtheworld,andwateruseinBrazilandtheDemocraticRepublicofCongo.
Itisclearthatglobalwaterneedsrosesignificantlybetween1900and2000,andthatagricultureaccountedforthelargestproportionofwaterused.WecanalsoseethatwaterconsumptionwasconsiderablyhigherinBrazilthanintheCongo.
In1900,around500km³ofwaterwasusedbytheagriculturesectorworldwide.Thefiguresforindustrialanddomesticwaterconsumptionstoodataroundonefifthofthatamount.By2000,globalwateruseforagriculturehadincreasedtoaround3000km³,industrialwaterusehadrisentojustunderhalfthatamount,anddomesticconsumptionhadreachedapproximately500km³.
Intheyear2000,thepopulationsofBrazilandtheCongowere176millionand5.2millionrespectively.WaterconsumptionperpersoninBrazil,at359m³,wasmuchhigherthanthatintheCongo,atonly8m³,andthiscouldbeexplainedbythefactthatBrazilhad265timesmoreirrigatedland.
(184words,band9)
Thebarchartcomparesthecostofanaveragehouseinfivemajorcitiesoveraperiodof13yearsfrom1989.
Wecanseethathousepricesfelloverallbetween1990and1995,butmostofthecitiessawrisingpricesbetween1996and2002.Londonexperiencedbyfarthegreatestchangesinhousepricesoverthe13-yearperiod.
Overthe5yearsafter1989,thecostofaveragehomesinTokyoandLondondroppedbyaround7%,whileNewYorkhousepriceswentdownby5%.Bycontrast,pricesrosebyapproximately2%inbothMadridandFrankfurt.
Between1996and2002,Londonhousepricesjumpedtoaround12%abovethe1989average.HomebuyersinNewYorkalsohadtopaysignificantlymore,withpricesrisingto5%abovethe1989average,buthomesinTokyoremainedcheaperthantheywerein1989.ThecostofanaveragehomeinMadridrosebyafurther2%,whilepricesinFrankfurtremainedstable.
(165words)
ThetablegivesinformationaboutpovertyratesamongsixtypesofhouseholdinAustraliaintheyear1999.
Itisnoticeablethatlevelsofpovertywerehigherforsinglepeoplethanforcouples,andpeoplewithchildrenweremorelikelytobepoorthanthosewithout.Povertyrateswereconsiderablyloweramongelderlypeople.
Overall,11%ofAustralians,or1,837,000people,werelivinginpovertyin1999.Agedpeopleweretheleastlikelytobepoor,withpovertylevelsof6%and4%forsingleagedpeopleandagedcouplesrespectively.
Justoveronefifthofsingleparentswerelivinginpoverty,whereasonly12%ofparentslivingwithapartnerwereclassedaspoor.Thesamepatterncanbeseenforpeoplewithnochildren:
while19%ofsinglepeopleinthisgroupwerelivingbelowthepovertyline,thefigureforcoupleswasmuchlower,
 升级会员
升级会员 