matlab应用历史.docx
《matlab应用历史.docx》由会员分享,可在线阅读,更多相关《matlab应用历史.docx(32页珍藏版)》请在冰豆网上搜索。

matlab应用历史
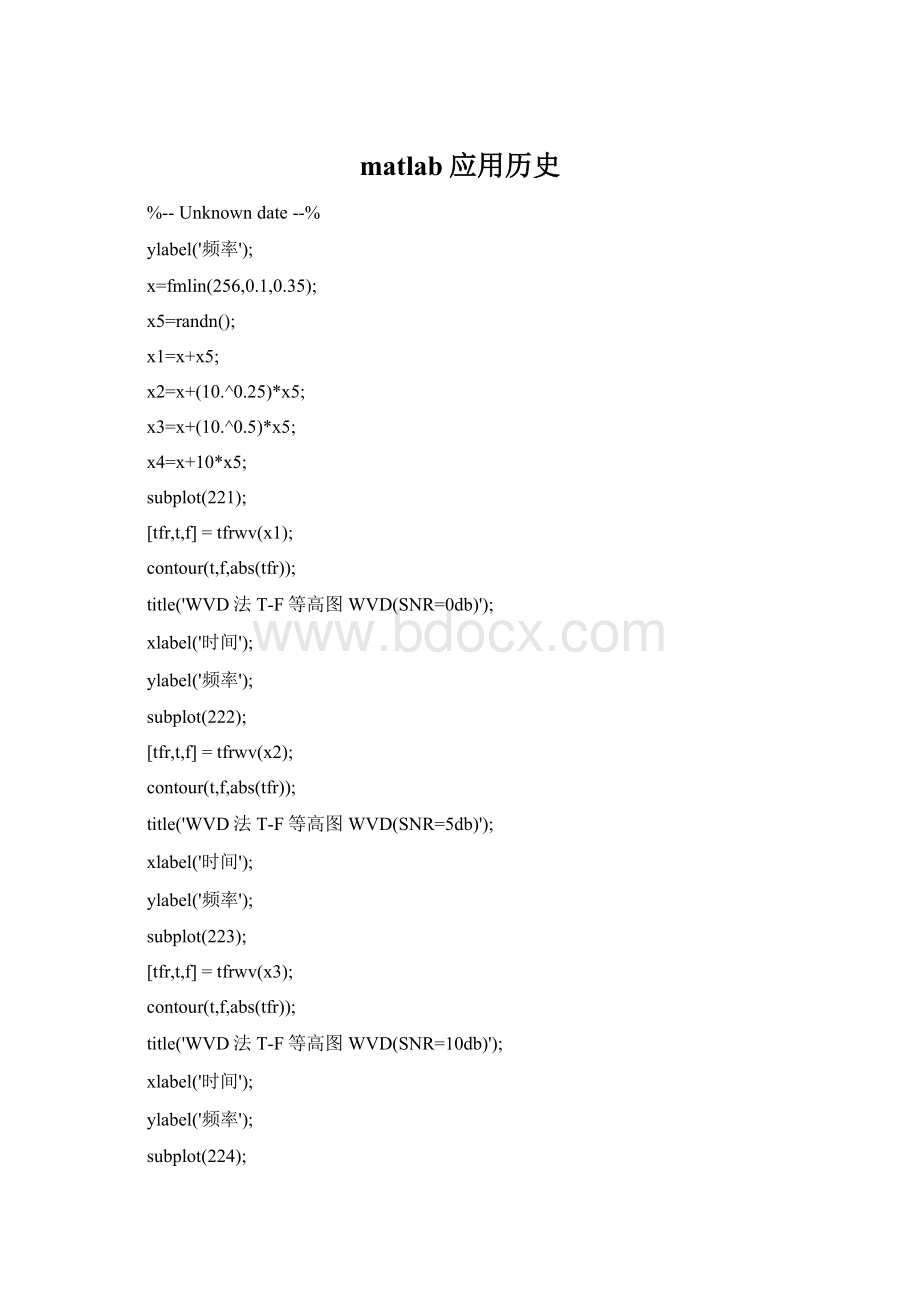
%--Unknowndate--%
ylabel('频率');
x=fmlin(256,0.1,0.35);
x5=randn();
x1=x+x5;
x2=x+(10.^0.25)*x5;
x3=x+(10.^0.5)*x5;
x4=x+10*x5;
subplot(221);
[tfr,t,f]=tfrwv(x1);
contour(t,f,abs(tfr));
title('WVD法T-F等高图WVD(SNR=0db)');
xlabel('时间');
ylabel('频率');
subplot(222);
[tfr,t,f]=tfrwv(x2);
contour(t,f,abs(tfr));
title('WVD法T-F等高图WVD(SNR=5db)');
xlabel('时间');
ylabel('频率');
subplot(223);
[tfr,t,f]=tfrwv(x3);
contour(t,f,abs(tfr));
title('WVD法T-F等高图WVD(SNR=10db)');
xlabel('时间');
ylabel('频率');
subplot(224);
[tfr,t,f]=tfrwv(x4);
contour(t,f,abs(tfr));
title('WVD法T-F等高图WVD(SNR=20db)');
xlabel('时间');
ylabel('频率');
%subplot(221);
%plot(real(x));
%title('幅值图');
%xlabel('频率Hz');
%ylabel('振幅');
%tfrwv(x1);
%title('WVD(SNR=0db)');
%xlabel('时间t');
%ylabel('频率f');
x=fmlin(256,0.1,0.35);
x5=randn();
x1=x+x5;
x2=x+(10.^0.25)*x5;
x3=x+(10.^0.5)*x5;
x4=x+10*x5;
subplot(221);
[tfr,t,f]=tfrwv(x1);
contour(t,f,abs(tfr));
title('WVD法T-F等高图WVD(SNR=0db)');
xlabel('时间');
ylabel('频率');
subplot(222);
[tfr,t,f]=tfrwv(x2);
contour(t,f,abs(tfr));
title('WVD法T-F等高图WVD(SNR=5db)');
xlabel('时间');
ylabel('频率');
subplot(223);
[tfr,t,f]=tfrwv(x3);
contour(t,f,abs(tfr));
title('WVD法T-F等高图WVD(SNR=10db)');
xlabel('时间');
ylabel('频率');
subplot(224);
[tfr,t,f]=tfrwv(x4);
contour(t,f,abs(tfr));
title('WVD法T-F等高图WVD(SNR=20db)');
xlabel('时间');
ylabel('频率');
clc
x1=fmlin(256,0.1,0.35);
x2=fmlin(256,0.2,0.4);
x=x1+x2;
subplot(221);
[tfr,t,f]=tfrwv(x1);
contour(t,f,abs(tfr));
title('WVD法T-F等高图WVD(SNR=0db)');
xlabel('时间');
ylabel('频率');
subplot(222);
[tfr,t,f]=tfrwv(x2);
contour(t,f,abs(tfr));
title('WVD法T-F等高图WVD(SNR=5db)');
xlabel('时间');
ylabel('频率');
subplot(223);
[tfr,t,f]=tfrwv(x);
contour(t,f,abs(tfr));
title('WVD法T-F等高图WVD(SNR=10db)');
xlabel('时间');
ylabel('频率');
subplot(224);
[tfr,t,f]=tfrstft(x);
contour(t,f,abs(tfr));
title('WVD法T-F等高图WVD(SNR=20db)');
xlabel('时间');
ylabel('频率');
%--11-4-21上午9:
59--%
helpsasd
a=0.004;
fs=250;
SNR=10;
n=0:
256-1;s=0.05*sasd(256,0.8);
w1=1.72;c=-0.025;t0=160;t1=100;
x0=fmlin(256,0.1,0.3);
x=x0;
x1=x+s;
subplot(221);
plot(n,real(x1));
title('线性调频信号和alpha稳定随机信号的叠加');
xlabel('时间');
ylabel('振幅');
P=(fft(x1));
subplot(222);
plot(n/length(n),abs(P));
title('线性调频信号和alpha稳定随机信号的叠加');
xlabel('频率');
ylabel('振幅');
subplot(223);[tfr,t,f]=tfrstft(x1);contour(t,f,abs(tfr));holdon;
title('STFT法T-F等高图');
xlabel('时间');
ylabel('频率');
subplot(224);[tfr1,t1,f1]=flotfrstft(x1);contour(t1,f1,abs(tfr1));holdon;
title('FLOSTFT法T-F等高图');
xlabel('时间');
ylabel('频率');
clc
a=0.004;
fs=250;
SNR=10;
n=0:
256-1;s=0.05*sasd(256,0.8);
w1=1.72;c=-0.025;t0=160;t1=100;
x0=fmlin(256,0.1,0.3);
x=x0;
x1=x+s;
figure
(1);
plot(n,real(x));
title('两个复线性调频信号');
xlabel('时间');
ylabel('振幅');
P=fftshift(fft(x));
figure
(2);
plot(n/length(n),abs(P));
title('两个复线性调频信号频谱');
xlabel('频率');
ylabel('振幅');
figure(3);
plot(n,real(x1));
title('两个复线性调频信号');
xlabel('时间');
ylabel('振幅');
P=fftshift(fft(x1));
figure(4);
plot(n/length(n),abs(P));
title('两个复线性调频信号频谱');
xlabel('频率');
ylabel('振幅');
figure(5);[tfr,t,f]=tfrwv(x1);contour(t,f,abs(tfr));
title('WVD法T-F等高图');
xlabel('时间');
ylabel('频率');
figure(6);[tfr1,t1,f1]=flotfrwv(x1);contour(t1,f1,abs(tfr1));
title('FLOWVD法T-F等高图');
xlabel('时间');
ylabel('频率');
a=0.004;
fs=250;
SNR=10;
n=0:
256-1;s=0.05*sasd(256,0.8);
w1=1.72;c=-0.025;t0=160;t1=100;
x0=fmlin(256,0.1,0.3);
x=x0;
x1=x+s;
subplot(321);
plot(n,real(x));
title('两个复线性调频信号');
xlabel('时间');
ylabel('振幅');
P=fftshift(fft(x));
subplot(322);
plot(n/length(n),abs(P));
title('两个复线性调频信号频谱');
xlabel('频率');
ylabel('振幅');
subplot(323);
plot(n,real(x1));
title('两个复线性调频信号');
xlabel('时间');
ylabel('振幅');
P=fftshift(fft(x1));
subplot(324);
plot(n/length(n),abs(P));
title('两个复线性调频信号频谱');
xlabel('频率');
ylabel('振幅');
subplot(325);[tfr,t,f]=tfrwv(x1);contour(t,f,abs(tfr));
title('WVD法T-F等高图');
xlabel('时间');
ylabel('频率');
subplot(326);[tfr1,t1,f1]=flotfrwv(x1);contour(t1,f1,abs(tfr1));
title('FLOWVD法T-F等高图');
xlabel('时间');
ylabel('频率');
clc
a=0.004;
fs=250;
SNR=10;
n=0:
256-1;s=0.05*sasd(256,0.8);
w1=1.72;c=-0.025;t0=160;t1=100;
x0=fmlin(256,0.1,0.3);
x=x0;
x1=x+s;
subplot(321);
plot(n,real(x));
title('线性调频信号');
xlabel('时间');
ylabel('振幅');
P=(fft(x));
subplot(322);
plot(n/length(n),abs(P));
title('线性调频信号频谱');
xlabel('频率');
ylabel('振幅');
subplot(323);
plot(n,real(x1));
title('线性调频信号');
xlabel('时间');
ylabel('振幅');
P=fft(x1);
subplot(324);
plot(n/length(n),abs(P));
title('线性调频信号频谱');
xlabel('频率');
ylabel('振幅');
subplot(325);
[tfr,t,f]=tfrpwv(x1);contour(t,f,abs(tfr));
title('PWVD法T-F等高图');
xlabel('时间');
ylabel('频率');
subplot(326);
[tfr1,t1,f1]=flotfrPwv(x1);contour(t1,f1,abs(tfr1));
title('FLOPWVD法T-F等高图');
xlabel('时间');
ylabel('频率');
a=0.004;
fs=250;
SNR=10;
n=0:
256-1;s=0.05*sasd(256,0.8);
w1=1.72;c=-0.025;t0=160;t1=100;
x0=fmlin(256,0.1,0.3);
x=x0;
x1=x+s;
subplot(321);
plot(n,real(x));
title('线性调频信号');
xlabel('时间');
ylabel('振幅');
P=(fft(x));
subplot(322);
plot(n/length(n),abs(P));
title('线性调频信号频谱');
xlabel('频率');
ylabel('振幅');
subplot(323);
plot(n,real(x1));
title('线性调频信号和ALPHA稳定随机信号');
xlabel('时间');
ylabel('振幅');
P=fft(x1);
subplot(324);
plot(n/length(n),abs(P));
title('线性调频信号和ALPHA稳定随机信号');
xlabel('频率');
ylabel('振幅');
subplot(325);
[tfr,t,f]=tfrpwv(x1);contour(t,f,abs(tfr));
title('PWVD法T-F等高图');
xlabel('时间');
ylabel('频率');
subplot(326);
[tfr1,t1,f1]=flotfrPwv(x1);contour(t1,f1,abs(tfr1));
title('FLOPWVD法T-F等高图');
xlabel('时间');
ylabel('频率');
a=0.004;
fs=250;
SNR=10;
n=0:
256-1;s=0.05*sasd(256,0.8);
w1=1.72;c=-0.025;t0=160;t1=100;
x0=fmlin(256,0.1,0.3);
x=x0;
x1=x+s;
subplot(321);
plot(n,real(x));
title('性调频信号');
xlabel('时间');
ylabel('振幅');
P=fftshift(fft(x));
subplot(322);
plot(n/length(n),abs(P));
title('线性调频信号频谱');
xlabel('频率');
ylabel('振幅');
subplot(323);
plot(n,real(x1));
title('线性调频信号和ALPHA稳定随机信号');
xlabel('时间');
ylabel('振幅');
P=fftshift(fft(x1));
subplot(324);
plot(n/length(n),abs(P));
title('线性调频信号和ALPHA稳定随机信号频谱');
xlabel('频率');
ylabel('振幅');
subplot(325);[tfr,t,f]=tfrwv(x1);contour(t,f,abs(tfr));
title('WVD法T-F等高图');
xlabel('时间');
ylabel('频率');
subplot(326);[tfr1,t1,f1]=flotfrwv(x1);contour(t1,f1,abs(tfr1));
title('FLOWVD法T-F等高图');
xlabel('时间');
ylabel('频率');
a=0.004;
fs=250;
SNR=10;
n=0:
256-1;s=0.05*sasd(256,0.8);
w1=1.72;c=-0.025;t0=160;t1=100;
x0=fmlin(256,0.1,0.3);
x=x0;
x1=x+s;
subplot(321);
plot(n,real(x));
title('线性调频信号');
xlabel('时间');
ylabel('振幅');
P=(fft(x));
subplot(322);
plot(n/length(n),abs(P));
title('线性调频信号频谱');
xlabel('频率');
ylabel('振幅');
subplot(323);
plot(n,real(x1));
title('线性调频信号和ALPHA稳定随机信号');
xlabel('时间');
ylabel('振幅');
P=fft(x1);
subplot(324);
plot(n/length(n),abs(P));
title('线性调频信号和ALPHA稳定随机信号频谱');
xlabel('频率');
ylabel('振幅');
subplot(325);
[tfr,t,f]=tfrpwv(x1);contour(t,f,abs(tfr));
title('PWVD法T-F等高图');
xlabel('时间');
ylabel('频率');
subplot(326);
[tfr1,t1,f1]=flotfrPwv(x1);contour(t1,f1,abs(tfr1));
title('FLOPWVD法T-F等高图');
xlabel('时间');
ylabel('频率');
a=0.004;
fs=250;
SNR=10;
n=0:
256-1;s=0.05*sasd(256,0.8);
w1=1.72;c=-0.025;t0=160;t1=100;
x0=fmlin(256,0.1,0.3);
x=x0;
x1=x+s;
subplot(221);
plot(n,real(x));
title('线性调频信号');
xlabel('时间');
ylabel('振幅');
P1=(fft(x));
subplot(222);
plot(n/length(n),abs(P1));
title('线性调频信号和alpha稳定随机信号的叠加');
xlabel('频率');
ylabel('振幅');
subplot(223);
plot(n,real(x1));
title('线性调频信号和alpha稳定随机信号的叠加');
xlabel('时间');
ylabel('振幅');
P=(fft(x1));
subplot(224);
plot(n/length(n),abs(P));
title('线性调频信号和alpha稳定随机信号的叠加');
xlabel('频率');
ylabel('振幅');
subplot(225);[tfr,t,f]=tfrstft(x1);contour(t,f,abs(tfr));holdon;
title('STFT法T-F等高图');
xlabel('时间');
ylabel('频率');
subplot(226);[tfr1,t1,f1]=flotfrstft(x1);contour(t1,f1,abs(tfr1));holdon;
title('FLOSTFT法T-F等高图');
xlabel('时间');
ylabel('频率');
a=0.004;
fs=250;
SNR=10;
n=0:
256-1;s=0.05*sasd(256,0.8);
w1=1.72;c=-0.025;t0=160;t1=100;
x0=fmlin(256,0.1,0.3);
x=x0;
x1=x+s;
subplot(231);
plot(n,real(x));
title('线性调频信号');
xlabel('时间');
ylabel('振幅');
P1=(fft(x));
subplot(232);
plot(n/length(n),abs(P1));
title('线性调频信号和alpha稳定随机信号的叠加');
xlabel('频率');
ylabel('振幅');
subplot(233);
plot(n,real(x1));
title('线性调频信号和alpha稳定随机信号的叠加');
xlabel('时间');
ylabel('振幅');
P=(fft(x1));
subplot(234);
plot(n/length(n),abs(P));
title('线性调频信号和alpha稳定随机信号的叠加');
xlabel('频率');
ylabel('振幅');
subplot(235);[tfr,t,f]=tfrstft(x1);contour(t,f,abs(tfr));holdon;
title('STFT法T-F等高图');
xlabel('时间');
ylabel('频率');
subplot(236);[tfr1,t1,f1]=flotfrstft(x1);contour(t1,f1,abs(tfr1));holdon;
title('FLOSTFT法T-F等高图');
xlabel('时间');
ylabel('频率');
a=0.004;
fs=250;
SNR=10;
n=0:
256-1;s=0.05*sasd(256,0.8);
w1=1.72;c=-0.025;t0=160;t1=100;
x0=fmlin(256,0.1,0.3);
x=x0;
x1=x+s;
subplot(321);
plot(n,real(x));
title('线性调频信号');
xlabel('时间');
ylabel('振幅');
P1=(fft(x));
subplot(322);
plot(n/length(n),abs(P1));
title('线性调频信号和alpha稳定随机信号的叠加');
xlabel('频率');
ylabel('振幅');
subplot(323);
plot(n,real(x1));
ti