数学建模实验二.docx
《数学建模实验二.docx》由会员分享,可在线阅读,更多相关《数学建模实验二.docx(16页珍藏版)》请在冰豆网上搜索。
数学建模实验二
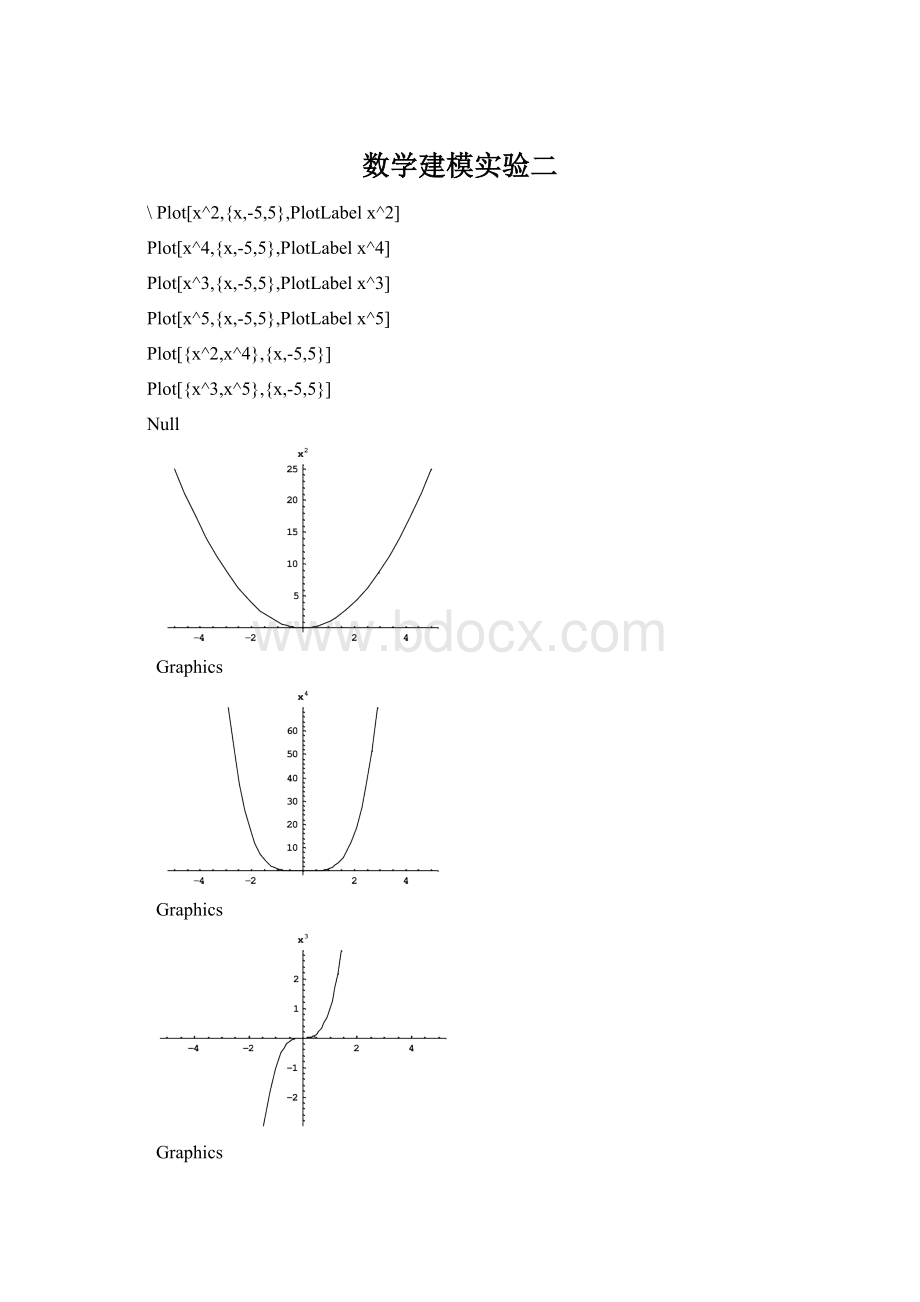
\Plot[x^2,{x,-5,5},PlotLabelx^2]
Plot[x^4,{x,-5,5},PlotLabelx^4]
Plot[x^3,{x,-5,5},PlotLabelx^3]
Plot[x^5,{x,-5,5},PlotLabelx^5]
Plot[{x^2,x^4},{x,-5,5}]
Plot[{x^3,x^5},{x,-5,5}]
Null
Graphics
Graphics
Graphics
Graphics
Graphics
Graphics
Plot[Sin[x],{x,-2Pi,2Pi},PlotLabelSin[x]]
Plot[Cos[x],{x,-2Pi,2Pi},PlotLabelCos[x]]
Plot[Tan[x],{x,-2Pi,2Pi},PlotLabelTan[x]]
Plot[Cot[x],{x,-2Pi,2Pi},PlotLabelCot[x]]
Plot[Sec[x],{x,-2Pi,2Pi},PlotLabelSec[x]]
Plot[Csc[x],{x,-2Pi,2Pi},PlotLabelCsc[x]]
Null
Graphics
Graphics
Graphics
Graphics
Graphics
Graphics
Plot[ArcSin[x],{x,-1,1},PlotLabelArcSin[x],AspectRatioAutomatic]
Plot[ArcCos[x],{x,-1,1},PlotLabelArcCos[x],AspectRatioAutomatic]
Plot[ArcTan[x],{x,-20,20},PlotLabelArcTan[x]]
Plot[ArcCot[x],{x,-20,20},PlotLabelArcCot[x]]
Null
Graphics
Graphics
Graphics
Graphics
Plot[Sinh[x],{x,-5,5},PlotLabelSinh[x]]
Plot[Cosh[x],{x,-5,5},PlotLabelCosh[x]]
Plot[Tanh[x],{x,-5,5},PlotLabelTanh[x]]
Null
Graphics
Graphics
Graphics
Plot[ArcSinh[x],{x,-1,1},PlotLabelArcSinh[x]]
Plot[ArcCosh[x],{x,-1,1},PlotLabelArcCosh[x]]
Plot[ArcTanh[x],{x,-1,1},PlotLabelArcTanh[x]]
Graphics
Graphics
Graphics
Plot[Exp[x],{x,-5,5},PlotLabelExp[x]]
Plot[E^x,{x,-5,5},PlotLabelExp[x]]
Plot[2^x,{x,-5,5},PlotLabel2^x]
Null
Graphics
Graphics
Graphics
Plot[Log[x],{x,0,5},PlotLabel"Log[x]"]
Plot[Log[2,x],{x,0,5},PlotLabelLog[2,x]]
Plot[Log[2,x],{x,0,5},PlotLabel"Log[2,x]"]
Plot[{Log[x],Log[2,x]},{x,0,5}]
Null
Graphics
Graphics
Graphics
Graphics
(*作出立体图形*)
Plot3D[x^2+y^2,{x,-2,2},{y,-2,2}]
(*作出立体图形,而且限制因变量显示范围*)
Plot3D[x^2+y^2,{x,-2,2},{y,-2,2},PlotRange{0,5}]
(*作出立体图形,而且同时限制自变量和因变量显示范围*)
Plot3D[x^2+y^2,{x,-2,2},{y,-2,2},PlotRange{{0,2},{0,2},{0,5}}]
(*作出立体图形,而且显示全部图形*)
Plot3D[Sin[x]/x*Sin[y]/y,{x,-10,10},{y,-10,10}]
Plot3D[Sin[x]/x*Sin[y]/y,{x,-10,10},{y,-10,10},PlotRangeAll]
(*作出立体图形,而且规定采样点数*)
Plot3D[x^2+y^2,{x,-2,2},{y,-2,2},PlotPoints30]
(*作出图形,而且指定坐标轴的名称*)
Plot3D[x^2+y^2,{x,-2,2},{y,-2,2},AxesLabel{"x","y","z"}]
(*作出图形,而且规定观察点*)
Plot3D[x^2+y^2,{x,-2,2},{y,-2,2},ViewPoint{1.3,-2.5,1}]
(*用参数方程作出图形*)
ParametricPlot3D[{Sin[u]*Cos[v],Sin[u]*Sin[v],Cos[u]},{u,0,Pi},{v,0,2Pi}]
SurfaceGraphics
SurfaceGraphics
SurfaceGraphics
SurfaceGraphics
SurfaceGraphics
SurfaceGraphics
SurfaceGraphics
SurfaceGraphics
Graphics3D
(*作出函数的等值线图形*)
ContourPlot[Sin[x*y],{x,-5,5},{y,-5,5}]
(*作出函数的等值线图形,并规定图形的因变量显示范围*)
ContourPlot[Sin[x*y],{x,-5,5},{y,-5,5},PlotRange{0,1}]
(*作出函数的等值线图形,并规定采样点数*)
ContourPlot[Sin[x*y],{x,-5,5},{y,-5,5},PlotPoints30]
(*作出函数的等值线图形,并去掉阴影*)
ContourPlot[Sin[x*y],{x,-5,5},{y,-5,5},ContourShadingFalse]
(*作出函数的等值线图形,并规定等值线数*)
ContourPlot[Sin[x*y],{x,-5,5},{y,-5,5},Contours5]
ContourGraphics
ContourGraphics
ContourGraphics
ContourGraphics
ContourGraphics
(*做出图形,并储存变量t1与t2中*)
t1=Plot[Sin[x],{x,-Pi,Pi}]
t2=Plot[x,{x,-3,3}]
(*在同一坐标系中显示两幅图形*)
Show[t1,t2]
Graphics
Graphics
Graphics
 升级会员
升级会员 