雅思小作文概述.docx
《雅思小作文概述.docx》由会员分享,可在线阅读,更多相关《雅思小作文概述.docx(11页珍藏版)》请在冰豆网上搜索。
雅思小作文概述
雅思小作文概述
雅思考试分移民类(general)和学术类(academic),两者都包含一篇小作文,一般用20分钟。
根据剑桥雅思考试中心提供的信息,雅思小作文和大作文的评分标准一致,主要有一下四个方面。
应题(taskresponse)
协调性和连贯性(Coherenceandcohesion)
词汇量(Lexicalresource)
语法正确(Grammaticalaccuracy)
一图表作文
分为四种图:
饼图(piechart)、线图(linechart)、柱图(barchart)、表图(table)
图表作文写作流程
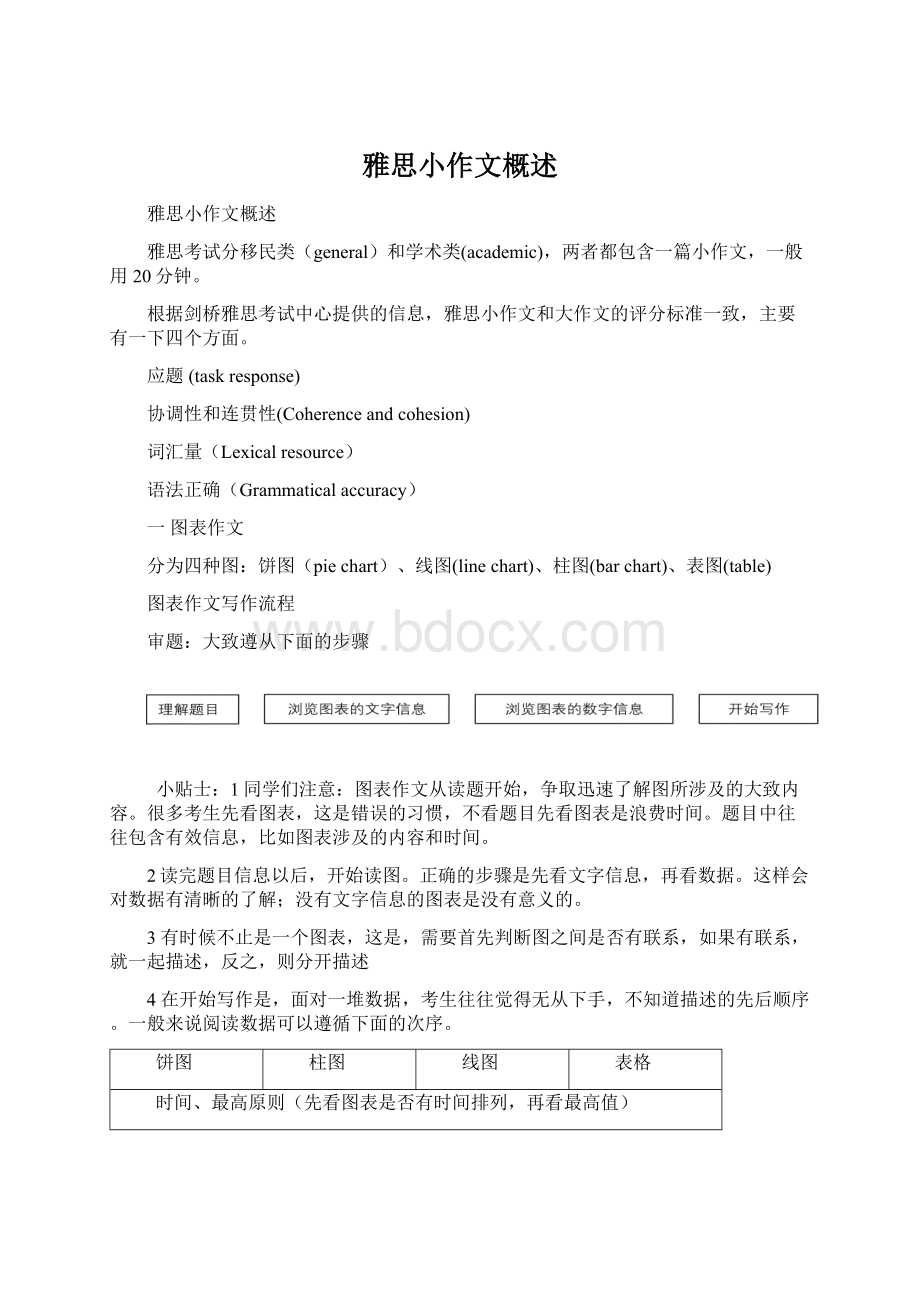
审题:
大致遵从下面的步骤
小贴士:
1同学们注意:
图表作文从读题开始,争取迅速了解图所涉及的大致内容。
很多考生先看图表,这是错误的习惯,不看题目先看图表是浪费时间。
题目中往往包含有效信息,比如图表涉及的内容和时间。
2读完题目信息以后,开始读图。
正确的步骤是先看文字信息,再看数据。
这样会对数据有清晰的了解;没有文字信息的图表是没有意义的。
3有时候不止是一个图表,这是,需要首先判断图之间是否有联系,如果有联系,就一起描述,反之,则分开描述
4在开始写作是,面对一堆数据,考生往往觉得无从下手,不知道描述的先后顺序。
一般来说阅读数据可以遵循下面的次序。
饼图
柱图
线图
表格
时间、最高原则(先看图表是否有时间排列,再看最高值)
●如果出现一组时间,那么以最早的时间开始叙述;譬如,1979-1999年,从1979年开始叙述(一般来说,线图和表格经常出现时间。
)
●如果在同一年代里出现可以比较的数据,那么从最高值开始叙述,譬如,在1979年出现几个国家的数值,那么从最高值开始描述;
●如果图表里没有出现时间,那么就关注最高值,从最高值开始叙述(饼图和柱状图一般不会出现时间的信息)
在随后的描述中,不需要描述所有的数据;注意描述最低的数值和有特点的数值;在线图中,注意描述趋势,而不是单个数据;在其他三种图表中,将近似的数据分组,一起描述。
在线图中,叙述以最后出现的数值结束;在其他图中,叙述以最低的数值结束。
开始写作
一般来说,图表小作文可以分为三个部分,分别是介绍段,主体部分和总结段;主体部分一般有两段话。
介绍段:
介绍段主要注意改写题目,不要照搬照抄。
避免照抄题目的方法有四种1)改变题目中关键词的词性;2)改变题目中关键词的位置;3)用同义次取代其中某一些词;4)灵活地加入图表中的其他文字信息(譬如说时间、性别、国家等)例如
题目:
thegraphsbelowshowtheenrolmentsofoverseasstudentsandlocalstudentsinBritain’suniversities.
介绍段:
thegraphsprovideinformationabouttheproportionsof
改写改写
overseasstudentsandlocalstudentsenrolledinBritain’suniversities
改词性和位置
from1989to1999.
加入新的信息
大意:
下面的图提供关于1989到1999年海外学生和当地学生在英国大学入学率的信息。
主体部分:
(2~3段)
第一句话总结图中比较显著的趋势或者特征,其余句子按照第四点中所规定的顺序逐句叙述图表内容。
主体部分每一个句子一般有三个组成部分,分别是文字信息、数字信息和比较。
很多考生习惯在作文中把数字逐一读出,这是不好的习惯。
事实上,文字信息比数字信息更为重要:
文字信息可以让读者清楚了解图表的主要信息,而数据只是起辅助的作用。
比较下面的句子
例如:
theaverageUSfamilyhad4.5peoplein1915,3.3in1967and2.6in2006.
改后句子:
averagefamilysizeintheUShasbeenshrinking,from
文字信息
3.3peoplein1967to2.6peoplein2006,
数字信息
comparedto4.5peoplein1915.
比较
图表范文分析:
图表作文范文
曲线图:
Thegraphbelowshowsthepercentageofpeopleunabletofindworkinthreemajorcountriesfrom1983to1992.
学习知识点:
1“上升和下降”,“平稳波动的说法”
1)theproportion(percentage)ofpeoplewhowereunabletofindworkdecreasedfrom13%in1983to8%to1990.
2)Thenumberofpeopleunabletofindworkshowedasignificantdecline,accountingfor8%in1990,comparedwith13%in1983
3)after7yearsofsteadydecline,thepercentageofpeopleunabletoworkstartedtorise.
ThelinegraphshowsacomparisonofunemploymentratesinJapan,theUnitedKingdomandCanadabetween1989and1992.
InJapan,thepercentageofunemploymentincreasedfrom2.3%to3%between1983and1986.Afterthat,thepercentagestarteddecreasingwithminorfluctuationandreturnedtotheoriginalvaluein1992.(第一组:
具体谈日本的变化趋势,起末点,最高最低)
In1983,thepercentageofunemployedpeoplewas12%inCanadaand13%intheUK.(起点)Thesevaluesdecreaseddramaticallyandataconstantrateoverthenextfewyears.(趋势)andunemploymentreachedthelowestpercentageinCanadawithabout7.7%in1988-1989,andintheUKwith7%in1989-1990.(最低点)(介词短语的并列形式)Theunemploymentratesofthetwocountriesreachesthesamepointbetween1988and1989.Andthenthefigures(替换))startedincreasinginbothcountries.in1992,Canadareacheditsoriginalvalue.Meanwhile,UKreached10%,threepointsbelowtheoriginalpercentagein1983.(终点)
Fromtheaboveanalysis,theunemploymentrateinJapanwasmorestablethanthoseofUKandCanada.(结论)
柱状图:
ThegraphbelowshowsthedifferentmodesoftransportusedtotraveltoandfromworkinoneEuropeancityin1950,1970,and1990.
Thebarchartrepresentsacontrastintermsofbus,car,bike,footinyearsof1950,1970and1990.
From1950to1990,thepercentageofpeoplewhotravel(替换)bybikeandonfootdecreasedfrom27%to7%and33%to10%respectively.Similarly,thepercentageofpeopletakingbusdroppedafter1970butincreasedbeforethat.However,car’spercentageusesharplyboomed(增速迅速发展)yearafteryear.(第一组:
柱自身比较)
Travelingbybikeoronfootweremostpopularin1950.butpercentageofcaruserswasfarmoresmaller.Aftertwodecades,withthedecreaseofbikeusersandtravelersonfoot,busandcargainalotofpopularity.Busreacheditspeakat27%.in1970,overoneoutofthree(替换)peopledrivetoandfromwork.(替换第二组,柱间比较)
Allinall,astheeconomyincreasesgradually,peopleprefertogotoworkandcomehomebydrivingratherthantakingbusorwalking.
表格图:
Thetablebelowshowsinformationonincome,taxesandpricesinfivecitiesaroundtheworld.Writeareportforauniversitylecturerdescribingtheinformationshownbelow.
City
Averagehourlywage
Taxas%ofwage
Monthlyrentfor4-bedroomflat
Athens
£4
18.9%
£700
Geneva
£13
26.6%
£1,300
HongKong
£3
15%
£2,400
London
£7
31.3%
£1,200
Tokyo
£12
19.3%
£5,300
Thistablegraphdemonstratesacomparisonofwages,taxesandrentsinfiveimportantcities,Athens,Geneva,HongKong,LondonandTokyo.
GenevaandTokyoofferthehighestaveragehourlywage,13and12poundsrespectively.Withinexpectation,thetaxaspercentageofwageisalsohigh.However,therentinTokyoismuchmorethanthatinGeneva.
Onthecontrary,thelowestwagesareofferedbyHongKongandAthens,3and4poundsrespectively.Itisnotsurprisingthatthetaxesarecorrespondinglylowerthantherest.Thedifferencebetweenthetwocitiesistherent,withthelowest700poundsinAthensandmorehigher2400poundsinHongKong.(第二组:
工资最高,相似和不同)
Withtheaveragerentandwage,Londonhasthehighesttax(其他有特点但未提到的)
Inconclusion,intermsoflivingcost,livinginLondonmightharderthantheothers.(合理推断)
饼状图:
Thetwopiechartsbelowshowthetypesofcommunicationusedin1962and1982.
Thetwopiechartsdemonstrateacomparisonindifferentpatternsofcommunicationwhichwereusedin1962and1982.
Aswhathasbeenshowninthetwocharts,thepercentageoflettersdrasticallydecreasedfrom50%in1962to10%in1982respectively.
Thefiguresofphoneandcomputerusage,onthecontrary,increasedcorrespondinglyatahighrate.Thepercentageofcomputercommunicationin1982wasexactlytwicethatin1962.Similarly,thepopularityofphonein1982canalsobesuggestedbyitsrise-25%fromtheoriginalvalue,35%.
Inconclusion,communicationdevices,aseconomyandtechnologyarebeingenhanced,havechangesgreatly.High-techwayswillgraduallytaketheplaceofprivateandtraditionalones.
高分范文展示
1.21世纪的利弊?
discuss?
Withourentranceto21stcentury,thererisesthecontroversyofwhetherourfuturewouldturntothebrightone.Manypeopleclaimthat21stcenturywouldbetakenintoapositivewaythroughscientificandtechnologicaladvancewhileagreatnumberofpessimistsarguethatourfutureisthreat123dbylotsofongoingdisasters.Asforme,Ipreferabalancedviewthattherewillbecrisisandopportunities.
Ononehand,wehavereasonstobeoptimistic.Foronething,thedevelopmentofinformationtechnologywillmakeitpossibletoforallthepeopleintheworldtocommunicatewitheachothereasily.Taketheinternetasanexample.Asimpleclickonthemousecouldleadyoutoeveryplaceandpersonallovertheworld.Foranother,asthemedicaltreatmentdevelops,itcouldbeexpectedthattherewillbecureforsuchdeadlydiseasesascancerandAIDSandthathumanbeingswouldbeabletoenjoyalonglifeexpectancy.Moreover,withtheongoingmechanization,anincreasingamountofdangerousandheavy-laborworkwouldtendtobetakenbytherobot.Inthiscase,mancanworkinmoresafeandcomfortableconditions,aswellasenjoymoreleisuretime.
Ontheotherhand,itcanbeforeseenthattheremaybecrisesinthefuture.First,peoplewillrunhighriskofpsychologicalproblemsfordealingwithcomputersinlong-termislikelytocausethelonelinessandinfantileautism.Consequentlytherateofsuicidewouldexperienceasharprise.Besides,thereispossibilitythattherobotwouldtakeovertheearth,enslavingourmankindwhoisoriginallyitscreator.Furthermore,itisnotimpossiblethataglobalnuclearwarwouldbreakout.Asaresult,noneofallcreaturesontheearthcanescapethisdisastersothatfromthenonthecivilhistorycomestoanend.
Fromthediscussionabove,itcanbeconcludedthatwewouldconfrontbothopportunitiesandcrises.Theadvancedscienceandtechnologycouldobtainmeritanddrawback.SowhatIhopetoseeinthefutureisthatwecanenjoyhealthierandlongerlifeandthatmoreandmorescienceandtechnologywillbeemployedinthepeacefulway.
2.Somepeopleclaimthattheincreasinglyfrequentbusinessandculturalcommunicationsarepositivewhereasothersholdadifferentopinion.Discuss.
Althoughaslightmentionofthepastpastorallifearousesanostalgiaandreminiscentbeauty,whichisunexceptionallycharacterizedbyisolationandsomewhatdisconsolation,variousandfrequentcommunicationsinbusiness,education,scientificresearch,andeventhedailylifearefloodingtheexistentvalues,ideas,andideals.Inevitably,thissocialphenomenonprovokesastormofcommendationandcriticismaswell.
Frequentcommunicationsinvariousfieldsamongculturesandpeopleundoubtedlybenefitindividuals’life.Almosteverycitizenbecomesthebeneficiaryofthecommunications.Peoplearoundtheworldtodayareabletoenjoyotherwiseunavailableproductsandservices.Forinstance,itisduetotheinternationalcommunicationinbusinessthatpeopleinChinacanenjoysuchhighqualityproductsasMercedesBenzfromGermany,TitoniwatchfromSwitzerland,andIBMcomputers.Allthesecasesdemonstrateonething:
communicationscontributetohumanbeings.
Notonlyarediversearrayofcommunicationsintheinternationalspectrumpositivetoindividuals,theyalsohavebeenexertingsignificantfavorableinfluencesonfamilylife.Itwasvirtually
 升级会员
升级会员 