中国城镇居民消费的计量经济学分析.docx
《中国城镇居民消费的计量经济学分析.docx》由会员分享,可在线阅读,更多相关《中国城镇居民消费的计量经济学分析.docx(17页珍藏版)》请在冰豆网上搜索。

中国城镇居民消费的计量经济学分析
中国城镇居民消费的计量经济学分析
财政与公共管理学院09税务2班刘超2009280092
摘要:
民生问题是我国现阶段的热点话题,从中央到地方,从国家决策层到普通百姓都高度重视我民生问题的现状和解决途径。
改革开放以来,我国经济呈现快速而稳定的增长趋势,由于我国分配制度和收入水平的变话,城镇居民生活水平在达到小康之后,消费结构和消费水平都出现了一些新特征、新问题。
本文根据我国近年来城镇居民消费的相关数据资料,运用一定的计量经济学的研究方法。
对影响消费的一些因素进行分析,并找到影响我国城镇居民消费的主要原因。
Abstract:
Livelihoodissuesisthecurrenthottopics,fromcentraltolocal,fromthenationaldecision-makerstoordinarypeopleattachgreatimportancetothestatusofmylivelihoodissuesandsolutions.Sincereformandopening,China'seconomyhasshownrapidandstablegrowthtrend,ourallocationsystemandtheincomelevelschange,thelivingstandardsoftheurbanresidentsinthewell-off,consumptionstructureandconsumptionlevelshaveemergedinanumberofnewfeaturesandnewproblems.Basedonthedataofconsumptionofurbanresidentsinrecentyears,theuseofeconometricmethods.Someofthefactorsaffectingconsumeranalysis,andfindthemainreasonaffectingtheconsumptionofurbanresidentsinChina.
关键词:
城镇居民消费计量经济学模型分析
正文:
随着改革开放的继续深入发展,人民的物质文化生活水平日益提高,消费结构和消费水平都有一定的调整,随着城镇化程度的提高,城镇居民消费在整个国民经济中的地位日益重要,“扩大内需”也是现阶段我国政府调控宏观经济的重要内容,因此对其进行计量经济分析,研究其规律是十分有必要的,也是大有裨益的。
一、建立模型,估计参数
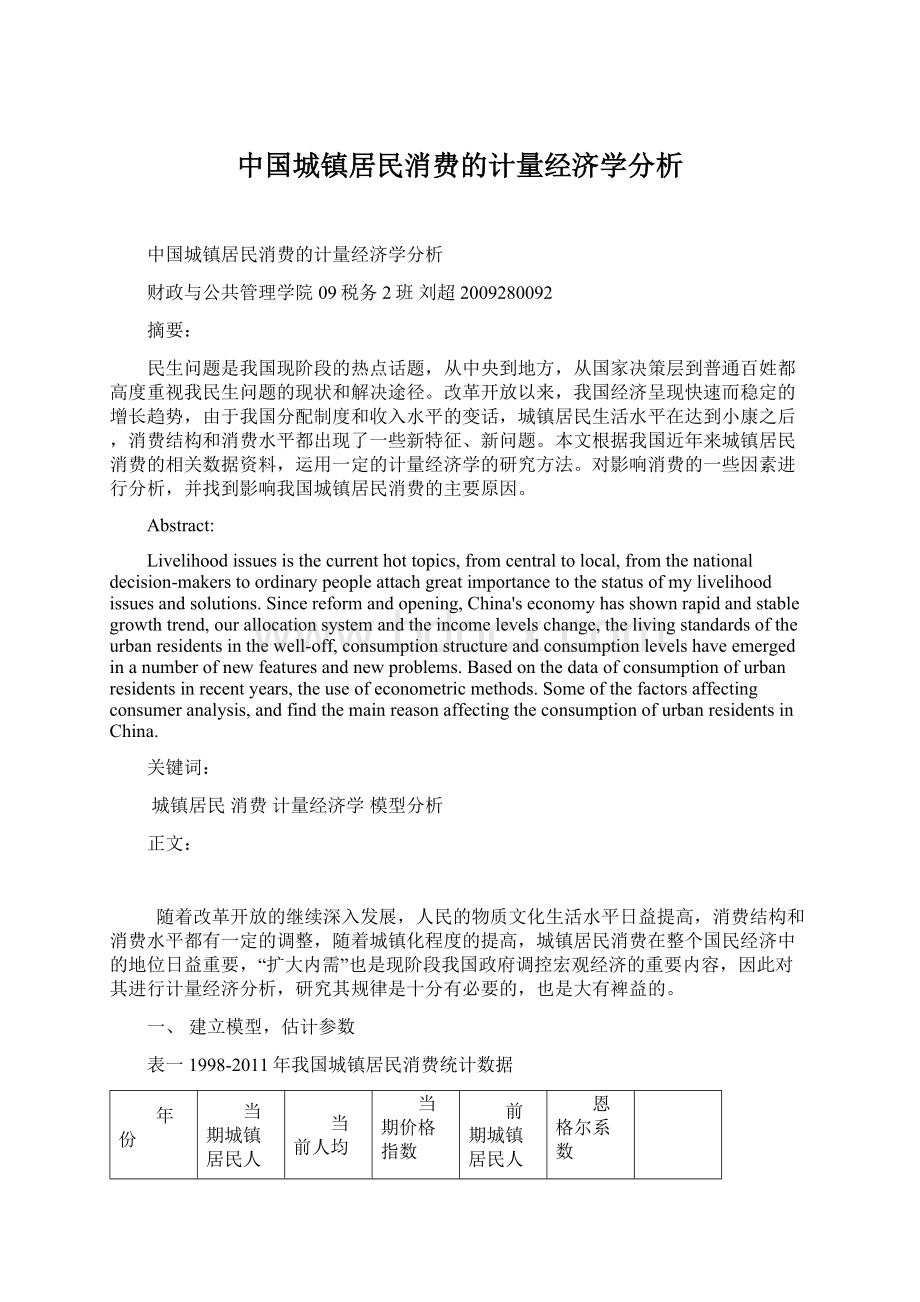
表一1998-2011年我国城镇居民消费统计数据
年份
当期城镇居民人均消费(元)
当前人均可支配收入
(元)
当期价格指数
前期城镇居民人均消费(元)
恩格尔系数
(%)
1998
4331.61
5425.1
99.4
4185.64
44.7
1999
4615.91
5854.0
98.7
4331.61
42.1
2000
4998
6280
100.8
4615.91
39.4
2001
5309.01
6859.6
100.7
4998
38.2
2002
6029.88
7702.8
99
5309.01
37.7
2003
6510.94
8472.2
100.9
6029.88
37.1
2004
7182.1
9421.6
103.3
6510.94
37.7
2005
7942.9
10493
101.6
7182.1
36.7
2006
8696.6
11759.5
101.5
7942.9
35.8
2007
9997.5
13785.8
104.5
8696.6
36.3
2008
11243
15780.8
105.6
9997.5
37.9
2009
12264.55
17175
99.1
11243
36.5
2010
13471.45
19109.44
99.3
12264.55
35.7
2011
15161
21810
99.5
13471.45
37.2
资料来源:
中国知网中国统计年鉴(居民消费价格指数以上一年=100计算)
根据我国居民实际情况,假设一般模型为:
,其中:
y为当期城镇居民人均消费支出,
为当期人均可支配收入,
为当期价格指数,
为前期城镇人均消费支出,u为随机扰动项。
利用eviews对数据进行最小二乘法分析如下
DependentVariable:
Y
Method:
LeastSquares
Date:
06/29/12Time:
00:
56
Sample:
19982011
Includedobservations:
14
Variable
Coefficient
Std.Error
t-Statistic
Prob.
C
-1201.884
1267.137
-0.948504
0.3652
X1
0.511816
0.092947
5.506532
0.0003
X2
18.03754
11.89297
1.516655
0.1603
X3
0.254951
0.159679
1.596653
0.1414
R-squared
0.999555
Meandependentvar
8411.032
AdjustedR-squared
0.999422
S.D.dependentvar
3507.833
S.E.ofregression
84.34140
Akaikeinfocriterion
11.94258
Sumsquaredresid
71134.71
Schwarzcriterion
12.12517
Loglikelihood
-79.59805
F-statistic
7492.472
Durbin-Watsonstat
1.820464
Prob(F-statistic)
0.000000
由以上结果可知,出去X1(当期人均可支配收入)以外,包括常数项在内的所有变量的t值相伴概率都远大于0.05即都不满足t检验时的显著性水平。
所以,要对模型进行调整,重新进行0LS估计。
经分别将每个变量进行一元回归,得出结果如下:
Y(当期城镇居民人均消费)与X1(当前人均可支配收入)的一元回归:
DependentVariable:
Y
Method:
LeastSquares
Date:
06/29/12Time:
01:
07
Sample:
19982011
Includedobservations:
14
Variable
Coefficient
Std.Error
t-Statistic
Prob.
C
865.5526
58.47586
14.80188
0.0000
X1
0.660523
0.004672
141.3850
0.0000
R-squared
0.999400
Meandependentvar
8411.032
AdjustedR-squared
0.999350
S.D.dependentvar
3507.833
S.E.ofregression
89.42869
Akaikeinfocriterion
11.95632
Sumsquaredresid
95969.89
Schwarzcriterion
12.04762
Loglikelihood
-81.69427
F-statistic
19989.72
Durbin-Watsonstat
0.887679
Prob(F-statistic)
0.000000
拟合优度:
0.9994
Y(当期城镇居民人均消费)与X2(当期价格指数)建立一元回归其结果如果下表所示:
DependentVariable:
Y
Method:
LeastSquares
Date:
06/29/12Time:
01:
08
Sample:
19982011
Includedobservations:
14
Variable
Coefficient
Std.Error
t-Statistic
Prob.
C
-10740.14
47271.22
-0.227203
0.8241
X2
189.6290
467.9666
0.405219
0.6924
R-squared
0.013499
Meandependentvar
8411.032
AdjustedR-squared
-0.068710
S.D.dependentvar
3507.833
S.E.ofregression
3626.342
Akaikeinfocriterion
19.36140
Sumsquaredresid
1.58E+08
Schwarzcriterion
19.45269
Loglikelihood
-133.5298
F-statistic
0.164203
Durbin-Watsonstat
0.088651
Prob(F-statistic)
0.692447
拟合优度:
0.013499
Y(当期城镇居民人均消费)与X3(前期城镇居民人均消费)的一元回归及其结果如下表所示:
DependentVariable:
Y
Method:
LeastSquares
Date:
06/29/12Time:
01:
09
Sample:
19982011
Includedobservations:
14
Variable
Coefficient
Std.Error
t-Statistic
Prob.
C
-253.0728
134.6523
-1.879454
0.0847
X3
1.135966
0.016450
69.05639
0.0000
R-squared
0.997490
Meandependentvar
8411.032
AdjustedR-squared
0.997281
S.D.dependentvar
3507.833
S.E.ofregression
182.9199
Akaikeinfocriterion
13.38754
Sumsquaredresid
401516.3
Schwarzcriterion
13.47883
Loglikelihood
-91.71276
F-statistic
4768.785
Durbin-Watsonstat
2.041571
Prob(F-statistic)
0.000000
拟合优度:
0.997490
经比较可知X1的拟合优度最高,X2的拟合优度最低,X3的拟合优度次之,后以X1的拟合优度为基准,分别计算X1与X2,X1与X3的拟合优度,并根据结果根据剔除变量X2,得:
DependentVariable:
Y
Method:
LeastSquares
Date:
06/29/12Time:
01:
21
Sample:
19982011
Includedobservations:
14
Variable
Coefficient
Std.Error
t-Statistic
Prob.
C
705.1150
166.0331
4.246833
0.0014
X1
0.567441
0.090312
6.283138
0.0001
X3
0.160450
0.155466
1.032057
0.3242
R-squared
0.999453
Meandependentvar
8411.032
AdjustedR-squared
0.999354
S.D.dependentvar
3507.833
S.E.ofregression
89.18695
Akaikeinfocriterion
12.00676
Sumsquaredresid
87497.43
Schwarzcriterion
12.14370
Loglikelihood
-81.04729
F-statistic
10049.65
Durbin-Watsonstat
0.978205
Prob(F-statistic)
0.000000
有图中结果可知,X3的t值相伴概率远远大于0.05,不满足t检验显著性水平,所以剔除变量X2、X3,则得出回归方程为:
Y=865.5526+0.6605*X1
(14.80188)(141.3850)
0.9994
二、模型检验
1.经济意义检验
由模型可知,城镇居民人均收入与人均消费支出是正相关关系,即随着城镇居民收入的增加或减少,消费支出也会相应的增加或减少。
说明此模型符合经济学的一般规律。
当前城镇居民可支配收入每增加一元,城镇居民人均消费支出就将增加0.6605元。
2.自相关检验
(1)杜宾-瓦森检验(DW检验)
已知DW=0.8877
因为n=14,k=1取显著性水平a=0.05时,查表得
,所以0即该模型存在一阶自相关
(2)布罗斯-戈弗雷检验(BG检验)结果如下:
Breusch-GodfreySerialCorrelationLMTest:
F-statistic
1.551670
Probability
0.258875
Obs*R-squared
3.315701
Probability
0.190548
TestEquation:
DependentVariable:
RESID
Method:
LeastSquares
Date:
06/29/12Time:
15:
02
Variable
Coefficient
Std.Error
t-Statistic
Prob.
C
28.40832
59.69310
0.475906
0.6444
X1
-0.002936
0.004940
-0.594317
0.5655
RESID(-1)
0.471108
0.335918
1.402449
0.1911
RESID(-2)
0.155491
0.355414
0.437491
0.6711
R-squared
0.236836
Meandependentvar
-6.82E-13
AdjustedR-squared
0.007887
S.D.dependentvar
85.92031
S.E.ofregression
85.58083
Akaikeinfocriterion
11.97176
Sumsquaredresid
73240.78
Schwarzcriterion
12.15434
Loglikelihood
-79.80229
F-statistic
1.034447
Durbin-Watsonstat
1.721471
Prob(F-statistic)
0.418654
经分析得出该模型不存在自相关性,这与DW检验结果相违背,其原因尚未可知。
2、异方差检验
(1)戈德菲尔德-匡特(G-Q)检验
为了方便操作检验建立Y与X1的新数据表如下
样本数据个数为n=14,C=4
SortX1将样本数据关于X1排序
SMPL19982002确定子样本1
LSYCX1
DependentVariable:
Y
Method:
LeastSquares
Date:
06/29/12Time:
15:
22
Sample:
19982002
Includedobservations:
5
Variable
Coefficient
Std.Error
t-Statistic
Prob.
C
315.6654
193.1678
1.634151
0.2007
X1
0.738013
0.029840
24.73226
0.0001
R-squared
0.995119
Meandependentvar
5056.882
AdjustedR-squared
0.993493
S.D.dependentvar
658.4521
S.E.ofregression
53.11632
Akaikeinfocriterion
11.07202
Sumsquaredresid
8464.029
Schwarzcriterion
10.91579
Loglikelihood
-25.68005
F-statistic
611.6847
Durbin-Watsonstat
3.422497
Prob(F-statistic)
0.000145
有上表可得到样本1的残差平方和
8464.029
SMPL20072011确定子样本2
LSYCX1
DependentVariable:
Y
Method:
LeastSquares
Date:
06/29/12Time:
15:
28
Sample:
20072011
Includedobservations:
5
Variable
Coefficient
Std.Error
t-Statistic
Prob.
C
1093.881
157.9212
6.926755
0.0062
X1
0.646446
0.008898
72.64979
0.0000
R-squared
0.999432
Meandependentvar
12427.50
AdjustedR-squared
0.999243
S.D.dependentvar
1993.511
S.E.ofregression
54.86444
Akaikeinfocriterion
11.13678
Sumsquaredresid
9030.320
Schwarzcriterion
10.98056
Loglikelihood
-25.84196
F-statistic
5277.991
Durbin-Watsonstat
2.378455
Prob(F-statistic)
0.000006
由表可得到样本2的残差平方和
9030.320
所以
=1.067
取a=0.05时,
而F=1.067<
所以该模型不存在异方差。
(2)怀特检验
WhiteHeteroskedasticityTest:
F-statistic
0.802368
Probability
0.472851
Obs*R-squared
1.782369
Probability
0.410170
TestEquation:
DependentVariable:
RESID^2
Method:
LeastSquares
Date:
06/29/12Time:
15:
44
Sample:
19982011
Includedobservations:
14
Variable
Coefficient
Std.Error
t-Statistic
Prob.
C
20465.95
11628.44
1.759991
0.1062
X1
-2.210497
2.034559
-1.086475
0.3005
X1^2
7.43E-05
7.72E-05
0.962897
0.3563
R-squared
0.127312
Meandependentvar
6854.992
AdjustedR-squared
-0.031358
S.D.dependentvar
6383.128
S.E.ofregression
6482.438
Akaikeinfocriterion
20.57899
Sumsquaredresid
4.62E+08
Schwarzcriterion
20.71593
Loglikelihood
-141.0529
F-statistic
0.802368
Durbin-Watsonstat
1.873589
Prob(F-statistic)
0.472851
由此表分析可知,取a=0.05,Obs*R-squared=1.782<
并且P值较大,模型异方差假设不成立。
(3)帕克检验:
利用eviews软件操作如下并得到结果:
LSYCX1
GENRLNE2=LOG(RESED^2)
GENRLNX1=LOG(X1)
LSLNE2CLNX1
DependentVariable:
LNE2
Method:
LeastSquares
Date:
06/29/12Time:
16:
00
Sample:
19982011
Includedobservations:
14
Variable
Coefficient
Std.Error
t-Statistic
Prob.
C
15.46366
8.096121
1.910008
0.0803
LNX1
-0.788118
0.874755
-0.900958
0.3853
R-squared
0.063358
Meandependentvar
8.177794
AdjustedR-squared
-0.014695
S.D.dependentvar
1.443128
S.E.ofregression
1.453694
Akaikeinfocriterion
3.717656
Sumsquaredresid
25.35870
Schwarzcriterion