雅思写作真题小作文.docx
《雅思写作真题小作文.docx》由会员分享,可在线阅读,更多相关《雅思写作真题小作文.docx(14页珍藏版)》请在冰豆网上搜索。

雅思写作真题小作文
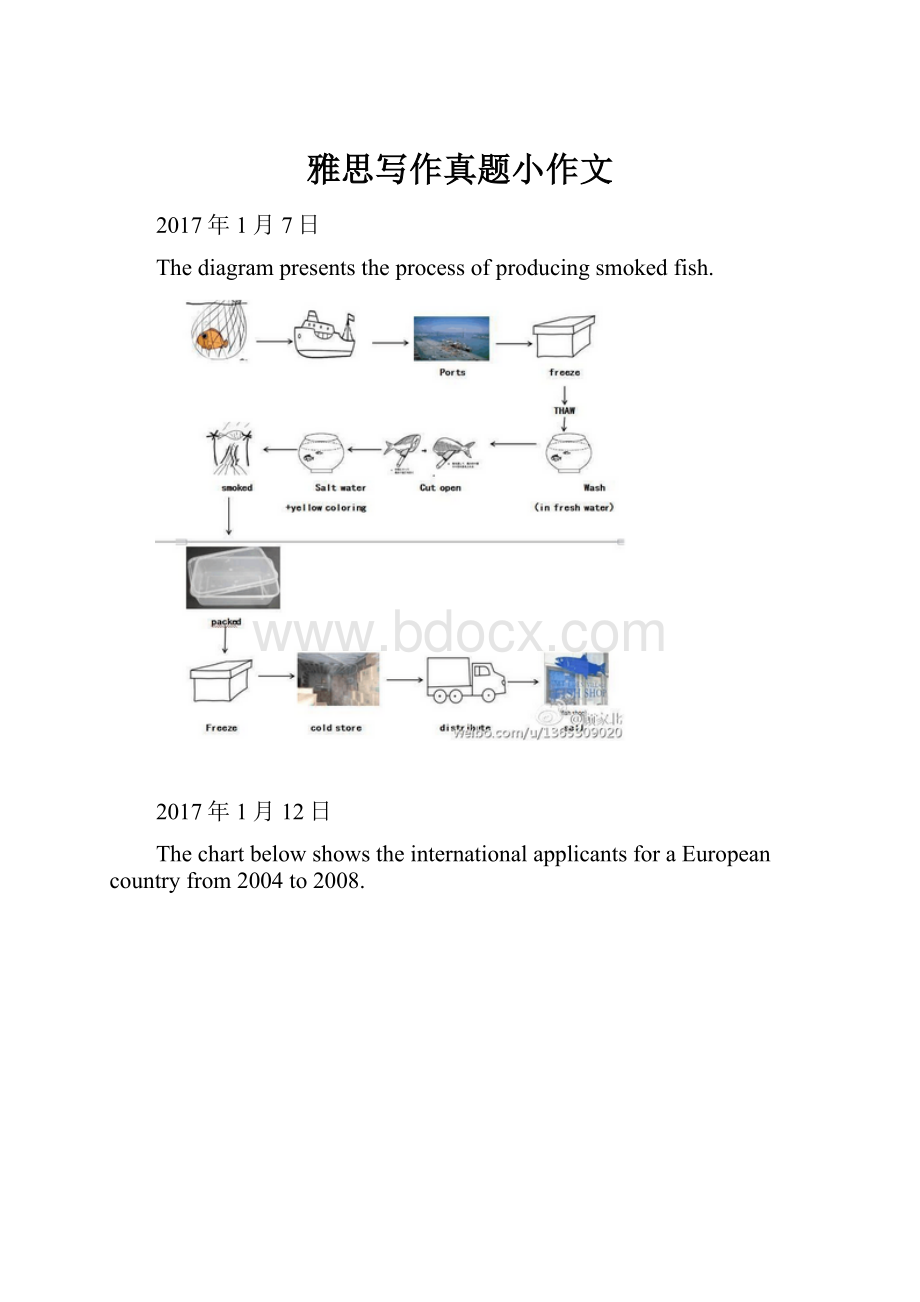
2017年1月7日
Thediagrampresentstheprocessofproducingsmokedfish.
2017年1月12日
ThechartbelowshowstheinternationalapplicantsforaEuropeancountryfrom2004to2008.
2017年1月14日
ThetablebelowshowstheincomeandexpenditureofHarckleyHall,apublicplaceforhiringovertheperiodofthreeyears.
2017年1月21日
ThechartbelowshoesthereasonswhypeoplestayinUKandleaveUK.
2017年2月11日
ThechartbelowshowsthepercentageofadultsnotdoingphysicalexerciseinAustraliain2005.
2017年2月16日
ThechartbelowshoesthepercentageofinternationalstudentsinCanadaandUSA,alsocomparethethreetopsourceofcountriesinCanadaandUSA.
2017年2月18日
2017年2月25日
Thefirstchartshowsthenumberofpeopleperkilometersquareofsixcountriesin2003.Thesecondchartshowsthepercentagechangeofpopulationinurbanareaofthesixcountriesfrom2003to2005.
2017年3月4日
Thediagrampresentstheprocessofproducingsmokedfish.
2017年3月18日
2017年3月25日
Thechartshowsthepercentageofdependentsintotalpopulationin5countries,comparedthenumberin2000andtheprojectionin2050.
2017年3月30日
Thechartshowsthepercentagesofbothmalesandfemaleswhoate5kindsoffruitsandvegetablesperdayof7agegroupsintheUK2006.
2017年4月8日
ThetablebelowshowstheemploymentrateandaverageannualsalaryofgraduatesfromtheAustralianUniversity.
2017年4月20日
ThechartbelowshowsthepercentageofpeopleusinginternetfordifferentactivitiesinanUKcityofyear2007and2009.
2017年4月22日
ThisdiagramshowstheonlineactivitiesofaparticularcityinBritainintheyearof2007and2009.
2017年4月29日
ThediagramsbelowshowthechangesofatowncalledBridgetownin1700and2000.
2017年5月6日
ThechartbelowgivesinformationaboutthepossessionofnewertechnologiesbydifferentagegroupsinUKin2009.
Summarizeimportantinformationandmakecomparisonandcontrast.
2017年5月13日
Thediagramsshowsamuseumanditssurroundingsin1900and2010.
2017年5月20日
Thegraphbelowshowsthepercentageofworkersin5differentEuropeancountrieswithadaysormoreillnessabsencefrom1991to2001.
2017年5月25日
ThechartbelowshowsthedestinationsofstudentsgraduatedfromphysicscoursesandArt&DesigninaEuropeancountryin2007.