雅思图表题范例.docx
《雅思图表题范例.docx》由会员分享,可在线阅读,更多相关《雅思图表题范例.docx(9页珍藏版)》请在冰豆网上搜索。
雅思图表题范例
雅思图表题范例
雅思TASK1
1、曲线图(剑7Test2W1)
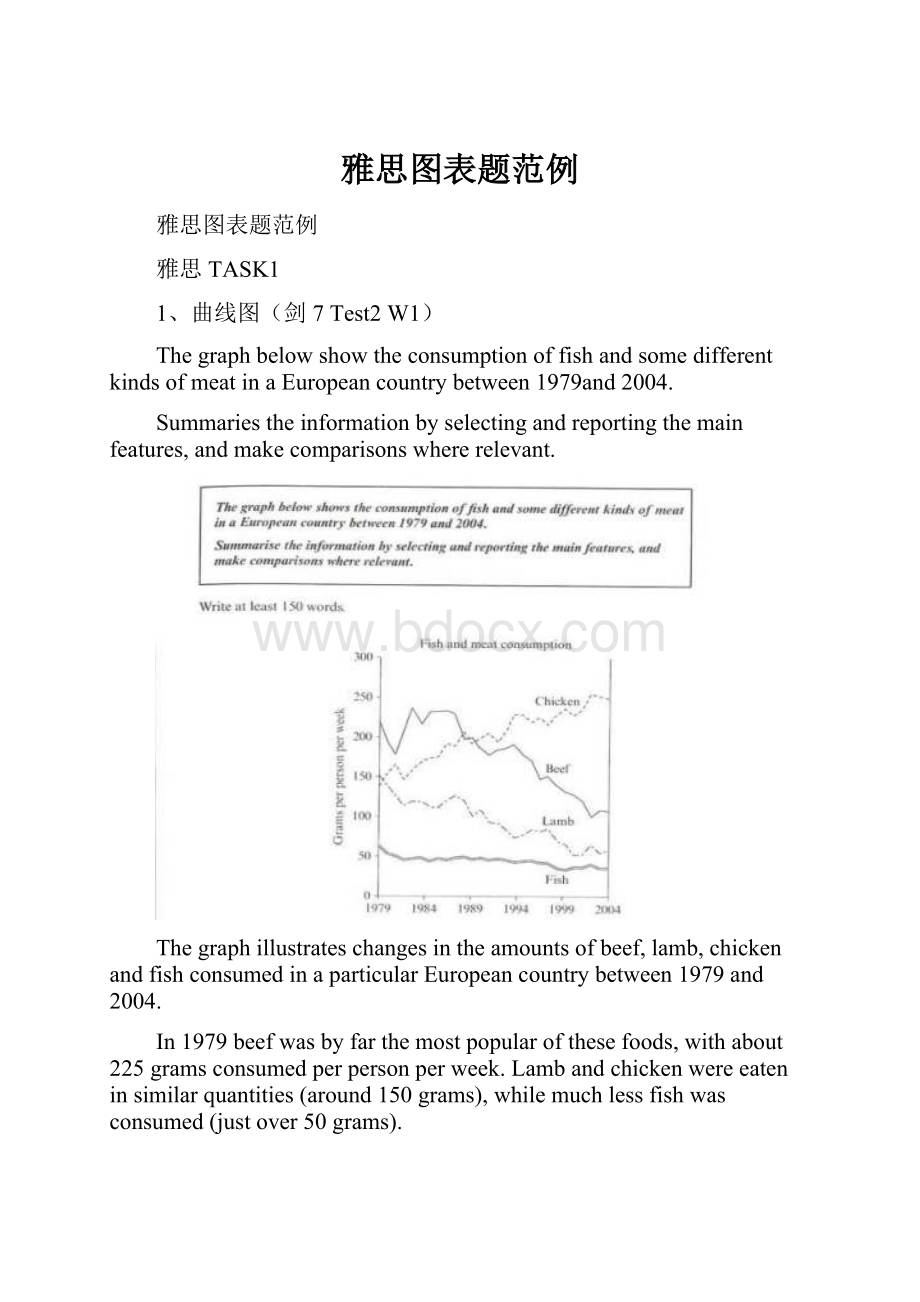
ThegraphbelowshowtheconsumptionoffishandsomedifferentkindsofmeatinaEuropeancountrybetween1979and2004.
Summariestheinformationbyselectingandreportingthemainfeatures,andmakecomparisonswhererelevant.
Thegraphillustrateschangesintheamountsofbeef,lamb,chickenandfishconsumedinaparticularEuropeancountrybetween1979and2004.
In1979beefwasbyfarthemostpopularofthesefoods,withabout225gramsconsumedperpersonperweek.Lambandchickenwereeateninsimilarquantities(around150grams),whilemuchlessfishwasconsumed(justover50grams).
However,duringthis25-yearperiodtheconsumptionofbeefandlambfelldramaticallytoapproximately100gramsand55gramsrespectively.Theconsumptionoffishalsodeclined,butmuchlesssignificantlytojustbelow50
3、饼状图(C7T4W1)
ThechartscomparethesourcesofelectricityinAustraliaandFranceintheyears1980and2000.Betweentheseyears,electricityproductionalmostdoubled,risingfrom100unitsto170inAustralia,andfrom90to180unitsinFrance.
In1980Australiausedcoalasthemainelectricitysource(50units)andtheremainderwasproducedfromnaturalgas,hydropower(eachproducing20units)andoil(whichproducedonly10units).By2000,coalhadbecomethefuelformorethan75%ofelectricityproducedandonlyhydrocontinuedtobeanothersignificantsourcesupplyingapproximately20%.
Incontrast,Franceusedcoalasasourceforonly25unitsofelectricityin1980,whichwasmatchedbynaturalgas.Theremaining40unitswereproducedlargelyfromoilandnuclearpower,withhydrocontributingonly5units.Butby2000,nuclearpower,whichwasnotusedatallinAustralia,haddevelopedintothemainsource,producingalmost75%ofelectricity,at126units,whilecoalandoiltogetherproducedonly50units.Othersourceswerenolongersignificant.
Overall,itisclearthatby2000thesetwocountriesreliedondifferentprincipalfuelsources:
AustraliareliedoncoalandFranceonnuclearpower.
4、表格类(C5T4W1)
Thetakebelowgivesinformationabouttheundergroundrailwaysystemsinsixcities.
Summarisetheinformationbyselectingandreportingthemainfeatures,andmakecomparisonswhererelevant.Youshouldwriteatleast150words.
Thetableshowsthedetailedinformationregardingtheundergroundrailwaysystemsinsixcities,namely,London,Paris,Tokyo,WashingtonDC,KyotoandLosAngeles.
Londonhastheoldestundergroundrailwaysystemamongthesixcitieswhichwasopenedin1863.AndParisisthesecondoldest,anditwasopenedin1900.Thiswasthenfollowedbyotherfourcities,namely,Tokyo,WashingtonDCandKyotowiththeopeningdateof1927,1976,and1981respectively.AsforLosAngeles,itisthelastoneinthistabletohaveitsownundergroundrailwaysystem(openedin2001).
Intermsofthesizeoftherailwaysystem,Londonenjoysthelargestundergroundrailwaysystems,with394kilometresofrouteintotal,whichisnearlytwiceaslargeasthatinParis(199kilometres).Kyoto,incontrast,hasthesmallestsystem,foritonlyhas11kilometresofroute,whichisnearly1/36oftherouteofLondon.Theotherthreecities(Tokyo,WashingtonDC,andLosAngeles)have155,126and28kilometresrespectively
Interestingly,Tokyo,whichonlyhas155kilometresofroute,enjoysthegreatestnumberofpassengersperyear,at1927millionpassengers.ThesysteminParishasthesecondgreatestnumberofpassengers,at1191millionspassengersperyear.Thesmallestundergroundrailwaysystem,Kyoto,servesthesmallestnumber(only45people).
Inconclusion,theundergroundrailwaysystemsindifferentcitiesvaryalotintheopeningdate,thesizeaswellasthenumberofpassengersservedperyear.
5、地图题(真题)
Thefollowingtwomapsshowthedevelopmentofacoastalcityfrom1950to2007.
Summarizetheinformationbyselectingandreportingthemainfeatures,andmakecomparisonswhererelevant.
Thetwomapsillustratethechangesofacoastalcitybetween1950and2007.Wecanseeclearlythatthecitybecamemoreandmoremodern.
1n1950,thecitywaslikeasmallvillage,withvastgrasslandareasalloverthecity.Therewasaseainthenorthofthiscity,withaparktothewest.Infrontofthepark,therewasabigbuildingareawherethingswereunderconstruction.Bythattime,threelargeareaswereallgrasslands,withacrossroaddividingthem.
However,whenitcomesto2007,thingsexperiencedsignificantchanges.Anewapartmenthadbeenbuiltwheretheparkwas,andtheoriginalbuildingareaswereconvertedintoindustrybuildingssuchasparks,parkinglotsandswimmingpools.Themostobviouschangeswerethattheformergrasslandsdisappeared,becomingcinemasinthesouthwest,shopsinthesoutheast,andhousesinthenortheast.Onthenorthside,althoughtheseawasstillthere,awharfwasbuiltinitsopeoplecouldtravelmoreeasilybysea.
Finally,althoughtherewasstillacrossroadinthecity,thehorizontalroadwasmovedtothesouth.Bydoingso,industrybuildingsandhousescouldbeleftmoreplacestodevelop.Anyway,thecityhadexperiencedtremendouschangesthroughoutthe57-yearperiod.
6、流程图(C6T3W1)
Thefirstdiagramshowsthattherearefourmainstagesinthelifeofthesilkworm.
Firstofall,eggsareproducedbythemothandittakestendaysforeacheggtobecomeasilkwormlarvathatfeedsonmulberryleaves.Thisstagelastsforuptosixweeksuntilthelarvaproducesacocoonofsilkthreadarounditself.Afteraperiodofaboutthreeweeks,theadultmothseventuallyemergefromthesecocoonsandthelifecyclebeginsagain.
Thecocoonsaretherawmaterialusedfortheproductionofsilkcloth.Onceselected,theyareboiledinwaterandthethreadscanbeseparatedintheunwindingstage.Eachthreadisbetween300and900metreslong,whichmeanstheycanbetwistedtogether,dyedandthenusedtoproduceclothintheweavingstage.
Overall,thediagramsshowthatthecocoonstageofthesilkwormcanbeusedtoproducesilkcloththroughaverysimpleprocess.
 升级会员
升级会员 