老外的标准雅思小作文范文分享.docx
《老外的标准雅思小作文范文分享.docx》由会员分享,可在线阅读,更多相关《老外的标准雅思小作文范文分享.docx(10页珍藏版)》请在冰豆网上搜索。

老外的标准雅思小作文范文分享
老外写的小作文范文,比较直观~~
第一篇
作文题目
第一篇范文参考
modelanswer:
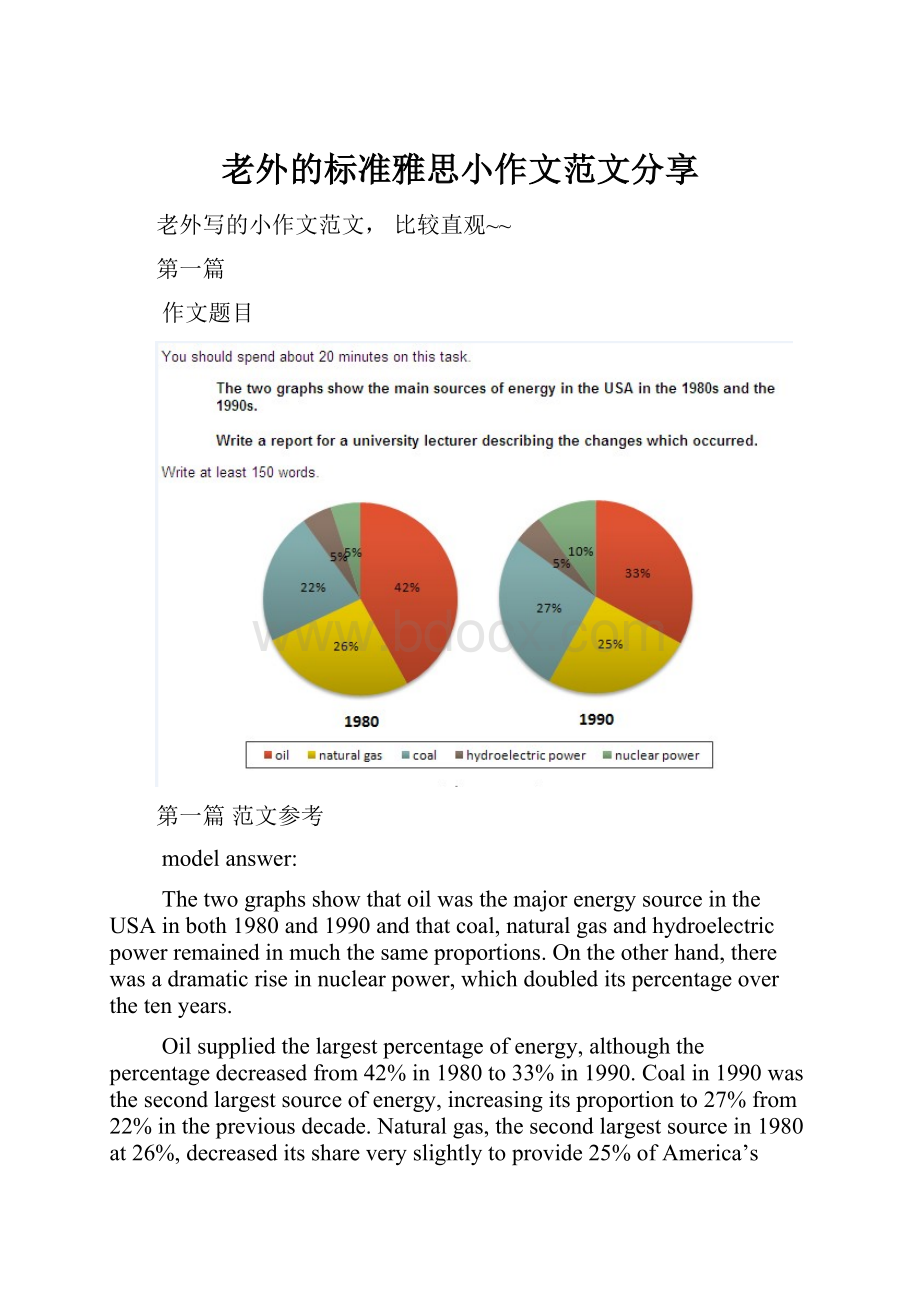
ThetwographsshowthatoilwasthemajorenergysourceintheUSAinboth1980and1990andthatcoal,naturalgasandhydroelectricpowerremainedinmuchthesameproportions.Ontheotherhand,therewasadramaticriseinnuclearpower,whichdoubleditspercentageoverthetenyears.
Oilsuppliedthelargestpercentageofenergy,althoughthepercentagedecreasedfrom42%in1980to33%in1990.Coalin1990wasthesecondlargestsourceofenergy,increasingitsproportionto27%from22%inthepreviousdecade.Naturalgas,thesecondlargestsourcein1980at26%,decreaseditsshareveryslightlytoprovide25%ofAmerica’senergytenyearslater.Therewasnochangeinthepercentagesuppliedbyhydroelectricpowerwhichremainedat5%ofthetotalenergyused.Nuclearpowerthegreatestchange:
in1990itwas10%,twicethatofthe1980s.
(152words)
第二篇
第二篇答案参考
modelanswer:
Thethreegraphsofwheatexportseachshowaquitedifferentpatternbetween1985and1990.ExportsfromAustraliadeclinedoverthefive-yearperiod,whiletheCanadianmarketfluctuatedconsiderably,andtheEuropeanCommunityshowedanincrease.
In1985,Australiaexportedabout15millionsoftonnesofwheatandthefollowingyearthenumberincreasedbyonemilliontonnesto16million.Afterthat,however,therewasagradualdeclineuntil1989and1990whenitstabilisedatabout11milliontonnes.Overthesameperiod,theamountofCanadianexportsvariedgreatly.Itstartedat19milliontonnesin1985,reachedapeakin1988of24million,droppeddramaticallyin1989to14milliontonnesandthenclimbedbackto19millionin1990.SeventeenmilliontonneswereexportedfromtheEuropeanCommunityin1985,butthisdecreasedto14milliontonnesin1986andthenroseto15millionin1987and1988beforeincreasingoncemoreto20millionin1990.
(165words)
第三篇(流程图哦,必看必看)
Youshouldspendabout20minutesonthistask.
Theflowchartillustratestheproductionofcolouredplasticpaperclipsinasmallfactory.
Writeareportforauniversitytutordescribingtheproductionprocess.
第三篇modelanswer
Therearefourmainstagesintheproductionofplasticpaperclipsfromthissmallfactory.Twoofthesestagesinvolveactualpreparationoftheclips,whiletheothertwoconsistofqualitycontrolbeforetheclipsaresentoutfromthefactorytotheretailerstobesoldtothepublic.
Tobeginwith,moltenplasticispouredintothreedifferentmouldsdependingonthecolourrequired;thecoloursarered,blueandyellow.Oncetheseclipsemergefromthemouldsaqualitycontrolmachinechecksthemforstrength.Unsatisfactoryclipsarerejected.Inthethirdstageintheprocesstheclipsarestoredbyhandintotwogroups,mixedandsinglecolours.Whenthisstageiscompletethegroupsarecheckedasecondtimetoensurethatthecolourmixturesaredividedcorrectlyintosinglecoloursandmixedcolourbatches.Finally,theclipsarepackedanddispatchedtothemarkets.
(152words)
第四篇表格题
Youshouldspendabout20minutesonthistask.
ThetablebelowgiveinformationaboutFavoritePastimesindifferentcountries.
Summarisetheinformationbyselectingandreportingthemainfeatures,andmakecomparisonswhererelevant.
Writeatleast150words.
第四篇参考答案
modelanswer:
Thistableclearlypresentsandcomparesfavorablepastimesineightdifferentcountries.Thepastimes,acrossthetopofthetable,areanalyzedinrelationtoeachcountry.
Ascanbeseen,about60%ofCanadians,AustraliansandAmericanslikewatchingtelevision.Ontheotherhand,thisfigureisquitelowforChinawhereonly15%ofpeoplewatchtelevision.Predictably,Americanslikemusicat23%,whereasonly2to5%ofpeopleintheothercountriesfeelthesameway.20%ofpeopleinEnglandenjoysleepingasapastimewhereasinCanadaandtheUSA,forexample,thefigureisonly2%.Interestingly,theChineselikehobbiesthemostat50%,asopposedtoonly20%inFrance.Itisn’tsurprisingthatthehighestpercentageofbeach-loversisinAustraliaandtheUSAat30%.
Itseemsthatpastimesofpeopleofdifferentnationalitiesmaybeinfluencedbyanumberoffactorssuchasthesocio-economicsituationortheclimate.Thesefactorsinfluenceculturaldifferencesbetweendifferentnationalitiesandmakecross-culturalexperiencesmoreinteresting.
(175words)
第五篇
Youshouldspendabout20minutesonthistask.
Writeareportforauniversitylecturerdescribingtheinformationshownbelow.
Youshouldwriteatleast150words.
第五篇参考答案
Inthisanalysiswewillexaminethreepiecharts.Thefirstoneisheaded‘WorldSpending.’Thesecondis‘WorldPopulation’andthethirdis‘ConsumptionofResources.’
Inthefirstchartwecanseethatpeoplespendmostoftheirincome(24%)onfood.Insomecountriesthispercentagewouldobviouslybemuchhigher.Transportandthenhousingarethenextmajorexpensesat18%and12%respectively.Only6%ofincomeisspentonclothing.
Inthesecondchartentitled‘WorldPopulation’,itisnotsurprisingtofindthat57%ofpeopleliveinAsia.InfactChinaandIndiaaretwoofthemostpopulatedcountriesintheworldandtheyarebothsituatedonthiscontinent.EuropeandtheAmericansaccountfornearly30%ofthetotal,whilst10%ofpeopleliveinAfrica.
Finally,thethirdchartrevealsthattheUSAandEuropeconsumeahuge60%oftheworld’sresource.
Tosumup,themajorexpenditureisonfood,thepopulationfiguresarethehighestforAsiaandthemajorconsumersaretheUSAandEurope.
(182words)
第六篇
Youshouldspendabout20minutesonthistask.
Thegraphandtablebelowgiveinformationaboutwateruseworldwideandwaterconsumptionintwodifferentcountries.
Summarisetheinformationbyselectingandreportingthemainfeatures,andmakecomparisonswhererelevant.
Writeatleast150words
第六篇参考答案
modelanswer:
Thegraphshowshowtheamountofwaterusedworldwidechangedbetween1900and2000.
Throughoutthecentury,thelargestquantityofwaterwasusedforagriculturalPurposes,andthisincreaseddramaticallyfromabout500km3toaround3,000km3intheyear2000.Waterusedintheindustrialanddomesticsectorsalsoincreased,butconsumptionwasminimaluntilmid-century.From1950onwards,industrialusegrewsteadilytojustover1,000km3,whiledomesticuserosemoreslowlytoonly300km3,bothfarbelowthelevelsofconsumptionbyagriculture.
ThetableillustratesthedifferencesinagricultureconsumptioninsomeareasoftheworldbycontrastingtheamountofirrigatedlandinBrazil(26,500km3)withthatintheD.R.C.(100km2).ThismeansthatahugeamountofwaterisusedinagricultureinBrazil,andthisisreflectedinthefiguresforwaterconsumptionperperson:
359m3comparedwithonly8m3intheCongo.Withapopulationof176million,thefiguresforBrazilindicatehowhighagriculturewaterconsumptioncanbeinsomecountries.
审题
ThemapbelowshowsthedevelopmentofthevillageofRyemouthbetween1995andpresent.
文章结构
第一段
交待写作目的
第二段
描述1995年的地图
第三段
拿现在的地图和95年的做对比
第四段
总结全文
第一段
ThisreportcompareshowthevillageofRyemouthhasdevelopedandchangedsincetheyearof1995.
题目:
ThemapbelowshowsthedevelopmentofthevillageofRyemouthbetween1995andpresent.
第二段
Asisclearlydescribedinthefirstpicture,Ryemouthwasacoastalcitywhichwasdividedintothreepartsbytworoads.Inthesouthernpart,therewasafishingportonthesea,withafishmarketlocatedinthenorthandacoffeeshopinthenorth-east.Ablockofshopswassituatedontheoppositesideofthemarket…
第三段
Inthesecondpicture,thevillagechangedalot.Thefishingporthasbeenremovedandthefishmarketisreplacedbyapartments.Severalrestaurantsalsooccupytheplaceoftheshopsontheroadside.Moreover,aparkinglotisnewlybuiltontheeastofthehotel.Inaddition,…
第四段
Overall,basedonthebriefdescriptionabove,itisclearthatthegenerallayoutofthevillagedoesnotchangealot,whilesomenewly-builtfacilitiesandhousinghasornamentedthesmallvillage.
1、征服畏惧、建立自信的最快最确实的方法,就是去做你害怕的事,直到你获得成功的经验。
2、忍别人所不能忍的痛,吃别人所别人所不能吃的苦,是为了收获得不到的收获。
就像驴子面前吊着个萝卜就会往前走。
正因为有那个目标,你才有劲儿往前走。