雅思写作小作文TASK1.docx
《雅思写作小作文TASK1.docx》由会员分享,可在线阅读,更多相关《雅思写作小作文TASK1.docx(33页珍藏版)》请在冰豆网上搜索。
第一章图表作文概述
图表分成Linechart,table,piechart,barchart,flowchart(3次)一、审题
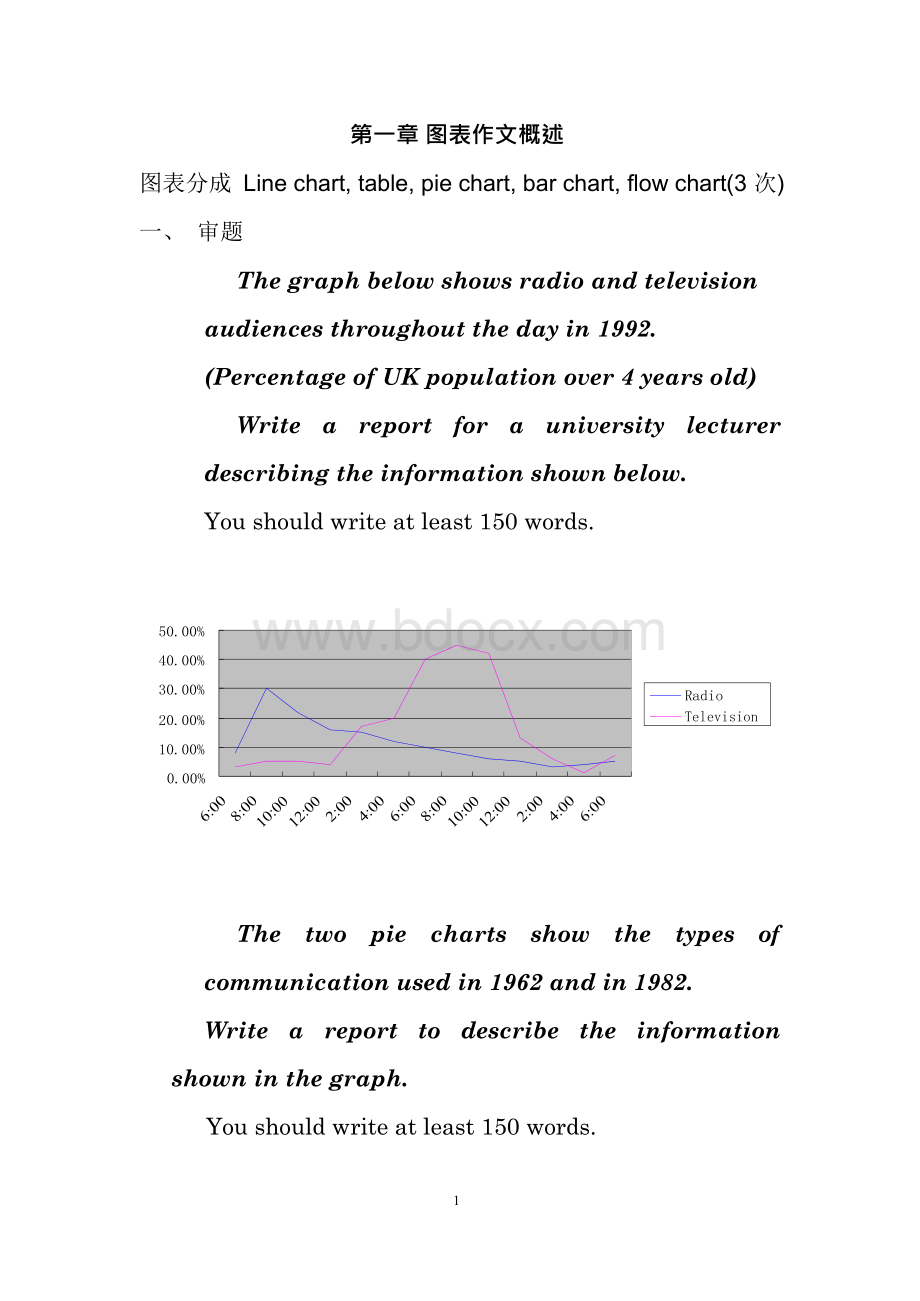
Thegraphbelowshowsradioandtelevisionaudiencesthroughoutthedayin1992.(PercentageofUKpopulationover4yearsold)
Write a report for a university lecturerdescribingtheinformationshownbelow.
Youshouldwriteatleast150words.
50.00%
40.00%
RadioTelevision
30.00%
20.00%
10.00%
0.00%
The two pie charts show the types ofcommunicationusedin1962andin1982.
Write a report to describe the informationshowninthegraph.
Youshouldwriteatleast150words.
33
P-phone
C-computerL-letter
P-phone
C-computerL-letter
Thediagrambelowshowstheaveragehoursofunpaidworkperweekdonebypeopleindifferentcategories.(Unpaidworkreferstosuchcategoriesaschildcareinthehome,houseworkandgardening.)
Describetheinformationpresentedbelow,comparingresultsformenandwomeninthecategoriesshown.
Youshouldwriteatleast150words.
60
50
40
30
20
10
0
no
children
�
1-2
children
�
marriedwomanmarriedman
3ormorechldren
Thetablebelowshowsinformationonincomes,taxesandpricesinfivecitiesaroundtheworld.
Write a report for a university lecturerdescribingtheinformationshownbelow.
Youshouldwriteatleast150words.
City
Average
hourlywage
Taxas%ofwage
Monthlyrent
for4-bedroomflat
Athens
£4
%
18.9
£700
Genev
£1
26.6
£1,30
a
3
%
0
Hong
£3
15%
£2,40
Kong
0
Londo
£7
31.3
£1,20
n
%
0
Tokyo
£1
19.3
£5,30
2
%
0
Thegraphandpiechartbelowgiveinformationonin-housetrainingcoursesinalargefinancialcompany.Writeareportforauniversitylecturerdescribingtheinformationshownbelow.
Youshouldwriteatleast150words.
Training-hoursperyear
TechnicalCareer
HealthandSafetyInterpersonalSkills
10
5
30
15
Office workers’ Attitude to
Training(%)
Wasteofvaluabletime
SecretaryManager
Importantforjob
Goodfornetworking
Goodexcuseforachange
0102030405060708090
审题:
1、审题目:
(题目相关的内容和时间)
2、审文字:
图标文字信息,比如坐标轴数据代表的信息,度量单位(图三)
3、审数字:
注意:
有时不止一个图表,先判断图标之间是否有联系,若有,就一起描述,若无则分开描述;若我们无法看出其中联系,最好分开描述。
(图五)
1) 不描述所有数据。
2)遵循时间、最高原则。
3)随后描述最低数值和有特点的数值4)线图(Line):
描述图表运
动趋势而非单个数据;另外三种中,将数据分组描述。
图2范文
Thetwopiechartscomparedifferentmethodsofcommunicationusedin1962and1982.Wecanseethatforthethreemediumssurveyed,therearesignificantchangesforeach.
In1962,letterwritingwasthemostpopularformofcommunication,takingup50%ofthetotal.However,itsusedecreaseddramaticallyafterthat.In1982,thisfiguredroppedtoonly10%,thesmallestofthatyear’sfigure.
Ontheotherhand,duringthissameperiod,wecanseethattheuseofthephoneandcomputersbothincreasedsignificantly.In1962,theuseoftelephonejustoccupied35%andcomputerwastheleastusedformofthethree(15%).In1982,thetelephone,withapercentageof60%,hasbecome
themostusedformofcommunication.Similarly,theuseofcomputersdoubledto30%.
图1范文
TVandradioaudienceintheU.K.differsharplythroughouttheday.Predictably,TVattractslargeraudiencesthanradio,butintheearlymorninghours,theradiogetbyfarthelargestsharewhile,intheevening,TVviewersaremostactive.
Lookingatthecourseofadayfromtheearlyhoursinthemorning,weseethattheindexforradiolistenersgrowssharplyfrom5%toapeakof25%justbetween6:
00and8:
30AM.Fromthatpointon,thenumberoflistenersdeclinesatagradualratetoeventuallyreturntotheoriginalvaluewiththeexceptionofanon-significantslightsurgeinthelateafternoonandatbedtime.
Whileradiolisteningstartsrisingintheearlymorning,theTVwatchinglevelisclosetozero.Asthedayproceeds,weseeaconstantupwardfluctuationthatcomestoapeakof45%around8:
00PMwithariseat8:
00to10:
00AMandanotheroneat1:
00to2:
00PM.From8:
00PMon,asteady
declinetoabout38%isfollowedbyadropto,again,almostzerointhenextfewhours.
一般分成2个部分:
介绍段、主体段(To be continued)04/09/2009
第二章介绍段
不抄题目,改写题目。
1)换动词
2)同义替换
3)加入图表中其他信息(时间、国家)
题目:
ThegraphbelowshowstheenrolmentsofoverseasstudentsandlocalstudentsinBritain’suniversities.
ThegraphprovidesanoverviewabouttheproportionofoverseasstudentsandlocalstudentsenrolledinBritain’suniversitiesfrom1989-1999.
题目:
Thegraphandtablebelowprovideinformationabout
wateruseworldwideandwaterconsumptionintwodifferentcountries.(剑6/30页)
试改:
Thegraph,combinedwiththetable(coupledwith),provideanoverviewaboutglobalwaterconsumptionfrom1900to2000
andwaterusedintwocountriesin2000
1.图表unfoldsaclearpictureabout
图表
prov
 升级会员
升级会员 