bkmsolch249e corrected 8910Word文档下载推荐.docx
《bkmsolch249e corrected 8910Word文档下载推荐.docx》由会员分享,可在线阅读,更多相关《bkmsolch249e corrected 8910Word文档下载推荐.docx(16页珍藏版)》请在冰豆网上搜索。

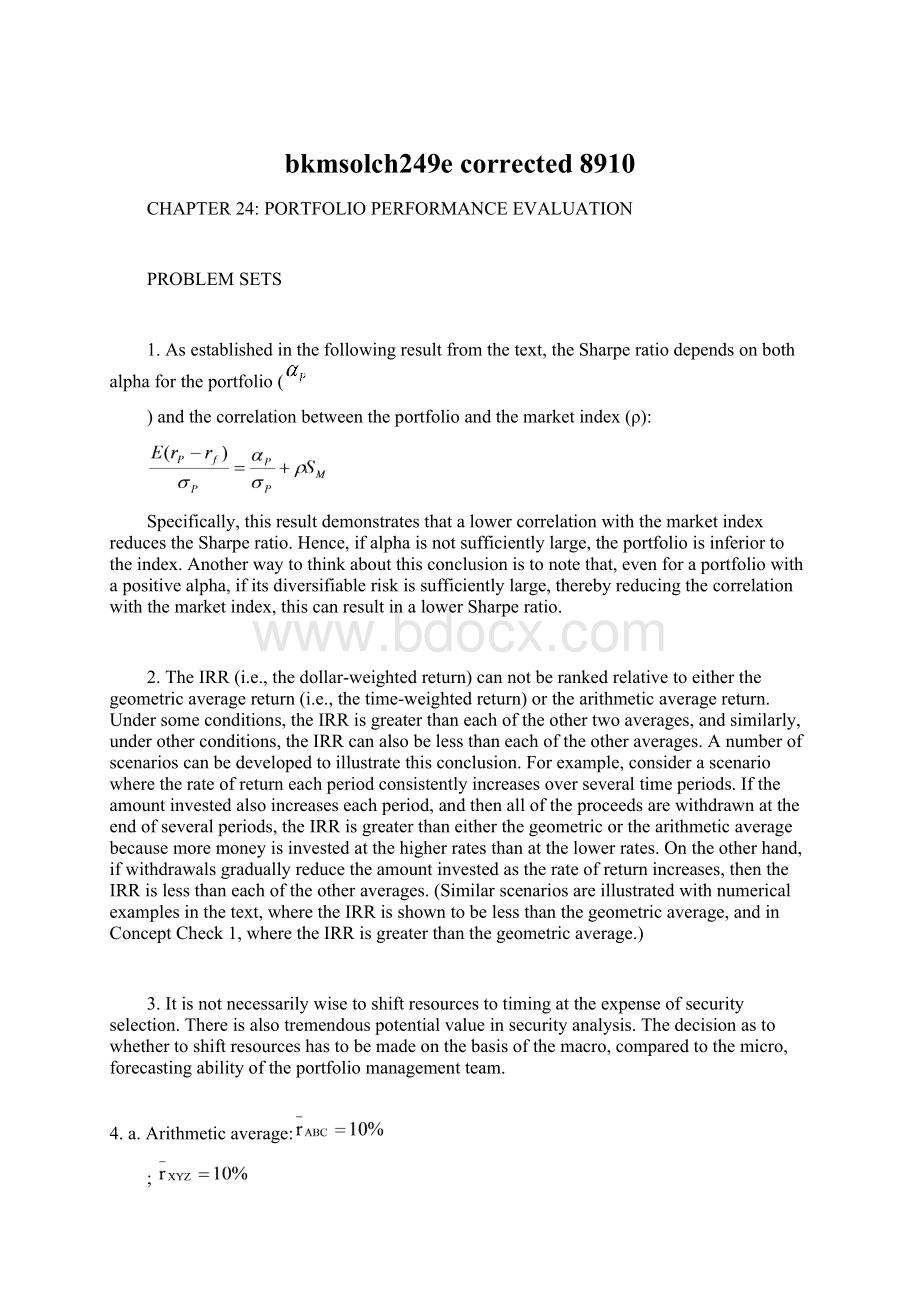
rXYZ=(1.30×
1.18×
1.00×
0.90)1/5–1=0.0911=9.11%
Despitethefactthatthetwostockshavethesamearithmeticaverage,thegeometricaverageforXYZislessthanthegeometricaverageforABC.ThereasonforthisresultisthefactthatthegreatervarianceofXYZdrivesthegeometricaveragefurtherbelowthearithmeticaverage.
d.Intermsof“forwardlooking”statistics,thearithmeticaverageisthebetterestimateofexpectedrateofreturn.Therefore,ifthedatareflecttheprobabilitiesoffuturereturns,10%istheexpectedrateofreturnforbothstocks.
5.a.Time-weightedaveragereturnsarebasedonyear-by-yearratesofreturn:
Year
Return=(capitalgains+dividend)/price
2007−2008
[($120–$100)+$4]/$100=24.00%
2008−2009
[($90–$120)+$4]/$120=–21.67%
2009−2010
[($100–$90)+$4]/$90=15.56%
Arithmeticmean:
(24%–21.67%+15.56%)/3=5.96%
Geometricmean:
(1.24×
0.7833×
1.1556)1/3–1=0.0392=3.92%
b.
Date
Cash
Flow
Explanation
1/1/07
–$300
Purchaseofthreesharesat$100each
1/1/08
–$228
Purchaseoftwosharesat$120lessdividendincomeonthreesharesheld
1/1/09
$110
Dividendsonfivesharesplussaleofoneshareat$90
1/1/10
$416
Dividendsonfoursharesplussaleoffoursharesat$100each
416
110
Date:
1/1/071/1/081/1/091/1/10
228
300
Dollar-weightedreturn=Internalrateofreturn=–0.1607%
6.
Time
Cashflow
Holdingperiodreturn
3×
(–$90)=–$270
1
$100
(100–90)/90=11.11%
2
0%
3
a.Time-weightedgeometricaveragerateofreturn=
(1.1111×
1.0×
1.0)1/3–1=0.0357=3.57%
b.Time-weightedarithmeticaveragerateofreturn=(11.11%+0+0)/3=3.70%
Thearithmeticaverageisalwaysgreaterthanorequaltothegeometricaverage;
thegreaterthedispersion,thegreaterthedifference.
c.Dollar-weightedaveragerateofreturn=IRR=5.46%
[Usingafinancialcalculator,enter:
n=3,PV=–270,FV=0,PMT=100.Thencomputetheinterestrate,orusetheCF0=−300,CF1=100,F1=3,thencomputeIRR].TheIRRexceedstheotheraveragesbecausetheinvestmentfundwasthelargestwhenthehighestreturnoccurred.
7.a.Thealphasforthetwoportfoliosare:
αA=12%–[5%+0.7×
(13%–5%)]=1.4%
αB=16%–[5%+1.4×
(13%–5%)]=–0.2%
Ideally,youwouldwanttotakealongpositioninPortfolioAandashortpositioninPortfolioB.
b.Ifyouwillholdonlyoneofthetwoportfolios,thentheSharpemeasureistheappropriatecriterion:
UsingtheSharpecriterion,PortfolioAisthepreferredportfolio.
8.
a.
StockA
StockB
(i)
Alpha=regressionintercept
1.0%
2.0%
(ii)
Informationratio=
0.0971
0.1047
(iii)
*Sharpemeasure=
0.4907
0.3373
(iv)
**Treynormeasure=
8.833
10.500
*TocomputetheSharpemeasure,notethatforeachstock,(rP–rf)canbecomputedfromtheright-handsideoftheregressionequation,usingtheassumedparametersrM=14%andrf=6%.Thestandarddeviationofeachstock’sreturnsisgivenintheproblem.
**ThebetatousefortheTreynormeasureistheslopecoefficientoftheregressionequationpresentedintheproblem.
b.(i)Ifthisistheonlyriskyassetheldbytheinvestor,thenSharpe’smeasureistheappropriatemeasure.SincetheSharpemeasureishigherforStockA,thenAisthebestchoice.
(ii)Ifthestockismixedwiththemarketindexfund,thenthecontributiontotheoverallSharpemeasureisdeterminedbytheappraisalratio;
therefore,StockBispreferred.
(iii)Ifthestockisoneofmanystocks,thenTreynor’smeasureistheappropriatemeasure,andStockBispreferred.
9.Weneedtodistinguishbetweenmarkettimingandsecurityselectionabilities.Theinterceptofthescatterdiagramisameasureofstockselectionability.Ifthemanagertendstohaveapositiveexcessreturnevenwhenthemarket’sperformanceismerely“neutral”(i.e.,haszeroexcessreturn),thenweconcludethatthemanagerhasonaveragemadegoodstockpicks.Stockselectionmustbethesourceofthepositiveexcessreturns.
Timingabilityisindicatedbythecurvatureoftheplottedline.Linesthatbecomesteeperasyoumovetotherightalongthehorizontalaxisshowgoodtimingability.Thesteeperslopeshowsthatthemanagermaintainedhigherportfoliosensitivitytomarketswings(i.e.,ahigherbeta)inperiodswhenthemarketperformedwell.Thisabilitytochoosemoremarket-sensitivesecuritiesinanticipationofmarketupturnsistheessenceofgoodtiming.Incontrast,adecliningslopeasyoumovetotherightmeansthattheportfoliowasmoresensitivetothemarketwhenthemarketdidpoorlyandlesssensitivewhenthemarketdidwell.Thisindicatespoortiming.
Wecanthereforeclassifyperformanceforthefourmanagersasfollows:
SelectionAbility
TimingAbility
A.
Bad
Good
B.
C.
D.
10.a.Bogey:
(0.60×
2.5%)+(0.30×
1.2%)+(0.10×
0.5%)=1.91%
Actual:
(0.70×
2.0%)+(0.20×
1.0%)+(0.10×
0.5%)=1.65%
Underperformance:
0.26%
b.SecuritySelection:
(1)
(2)
(3)=
(1)×
(2)
Market
Differentialreturn
withinmarket
(Manager–index)
Manager'
s
portfolioweight
Contributionto
performance
Equity
–0.5%
0.70
−0.35%
Bonds
–0.2%
0.20
–0.04%
0.0%
0.10
0.00%
Contributionofsecurityselection:
−0.39%
c.AssetAllocation:
Excessweight
(Manager–benchmark)
Index
Return
0.10%
2.5%
0.25%
–0.10%
1.2%
–0.12%
0.5%
Contributionofassetallocation:
0.13%
Summary:
Securityselection–0.39%
Assetallocation0.13%
Excessperformance–0.26%
11.a.Manager:
(0.30×
20%)+(0.10×
15%)+(0.40×
10%)+(0.20×
5%)=12.50%
Bogey:
(0.15×
12%)+(0.30×
15%)+(0.45×
14%)+(0.10×
12%)=13.80%
Addedvalue:
–1.30%
b.Addedvaluefromcountryallocation:
Country
IndexReturn
minusbogey
U.K.
0.15
−1.8%
−0.27%
Japan
–0.20
–0.24%
U.S.
−0.05
0.2%
−0.01%
Germany
−0.18%
Contributionofcountryallocation:
−0.70%
c.Addedvaluefromstockselection:
withincountry
(Manager–Index)
Manager’s
countryweight
0.08
0.30%
2.4%
0.00
−0.04
0.40%
−1.6%
−0.07
0.20%
−1.4%
Contributionofstockselection:
−0.6%
Countryallocation–0.70%
Stockselection−0.60%
Excessperformance–1.30%
12.Support:
Amanagercouldbeabetterperformerinonetypeofcircumstancethaninanother.Forexample,amanagerwhodoesnotiming,butsimplymaintainsahighbeta,willdobetterinupmarketsandworseindownmarkets.Therefore,weshouldobserveperformanceoveranentirecycle.Also,totheextentthatobservingamanageroveranentirecycleincreasesthenumberofobservations,itwouldimprovethereliabilityofthemeasurement.
Contradict:
Ifweadequatelycontrolforexposuretothemarket(i.e.,adjustforbeta),thenmarketperformanceshouldnotaffecttherelativeperformanceofindividualmanagers.It