牛头刨床机构运动分析文档格式.docx
《牛头刨床机构运动分析文档格式.docx》由会员分享,可在线阅读,更多相关《牛头刨床机构运动分析文档格式.docx(13页珍藏版)》请在冰豆网上搜索。
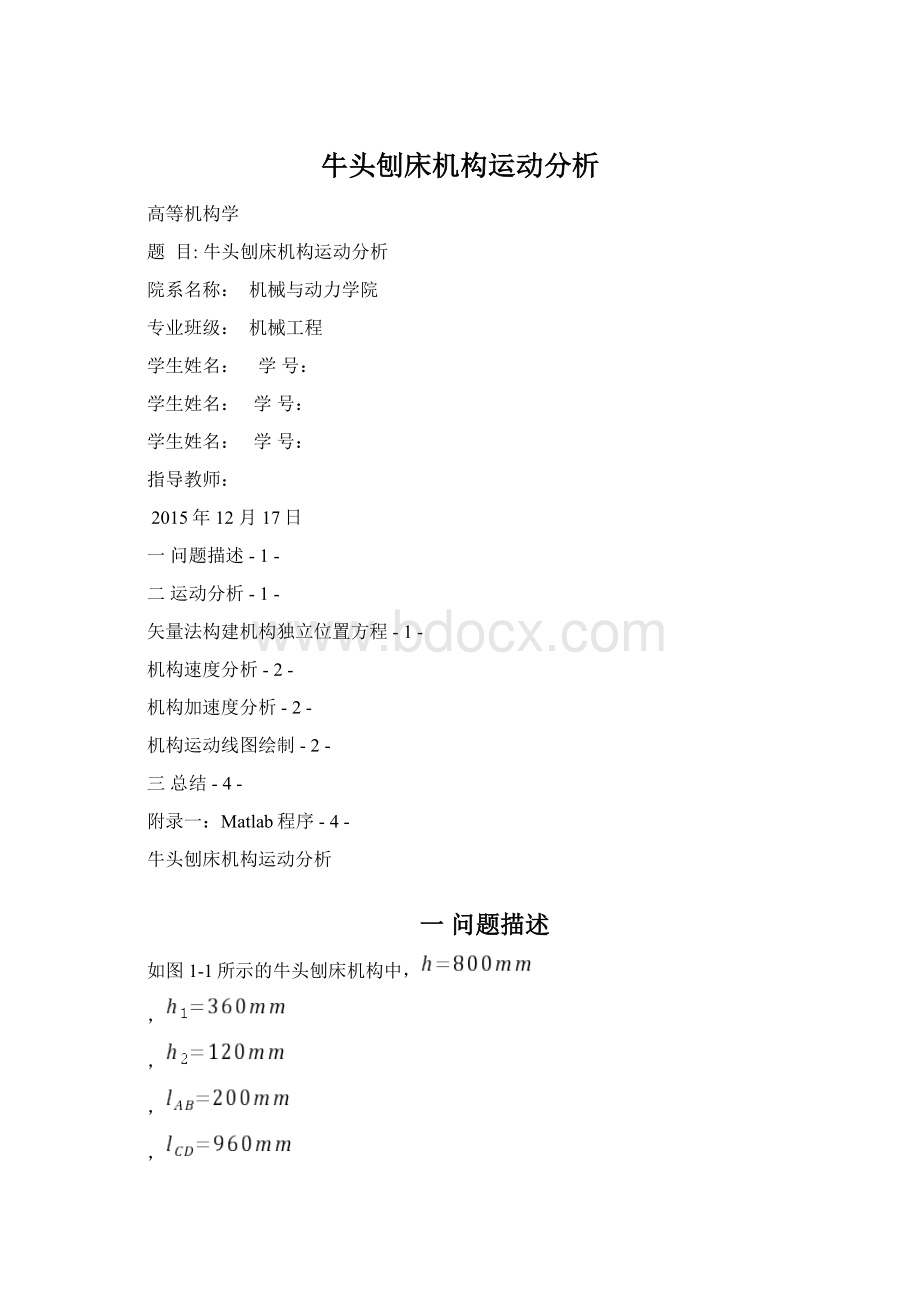
图2-1坐标系建立
以两个封闭图形ABDEA和EDCFE为基准构建两个封闭矢量位置方程,即:
将上述矢量方程分别沿X轴和Y轴进行投影,得牛头刨床机构的独立位置方程如下:
利用Matlab进行编程求解,可求得各机构的位置,程序见附录一。
机构速度分析
将机构的位置方程对时间求一次导数,并写成矩阵的形式,得机构的速度方程如下:
利用Matlab进行编程求解,可求得各机构的角速度或速度,程序见附录一。
机构加速度分析
将机构的速度方程对时间求一次导数,并写成矩阵的形式,得机构的加速度方程如下:
利用Matlab进行编程求解,可求得各机构的角加速度或加速度,程序见附录一。
机构运动线图绘制
通过Matlab进行计算求解,得到各构件的位置、速度和加速度,如表2-1所示。
根据所求得的各构件的位置、速度及加速度,进行机构运动线图的绘制,如图2-2所示。
程序见附录一。
表2-1各构件的位置、速度和加速度
/(°
)
/m
/(rad/s)
/(m/s)
/(rad/s2)
/(m/s2)
10
20
30
40
250
260
270
360
图2-2机构的运动线图
三总结
通过对牛头刨床机构的运动分析,让我们学会了如何使用矩阵法建立平面机构的运动方程。
对机构进行运动分析的关键是独立位置方程的建立和求解,由于独立位置方程是一个非线性方程组,计算难度较大。
本文借用了Matlab软件进行编程求解独立位置方程,同时对牛头刨床机构进行了运动仿真,并绘制了牛头刨床机构的运动线图,完成了从理论分析到编程求解的运动分析过程。
Matlab程序
(1)子函数
functionf=Position_Fun(x,theta1,h,h1,h2,l1,l3,l4)
f=[x
(1)*cos(x
(2))+l4*cos(x(3))-h2-l1*cos(theta1);
x
(1)*sin(x
(2))+l4*sin(x(3))-h1-l1*sin(theta1);
l3*cos(x
(2))+l4*cos(x(3))-x(4);
l3*sin(x
(2))+l4*sin(x(3))-h];
end
(2)子函数
function[theta,omega,alpha]=Six_Bar(theta0,theta1,omega1,alpha1,h,h1,h2,l1,l3,l4)
theta=fsolve(@(x)Position_Fun(x,theta1,h,h1,h2,l1,l3,l4),theta0);
S3=theta
(1);
theta3=theta
(2);
theta4=theta(3);
Sc=theta(4);
%计算连杆3、连杆4、滑块2和C点的速度
A=[cos(theta3)-S3*sin(theta3)-l4*sin(theta4)0;
sin(theta3)S3*cos(theta3)l4*cos(theta4)0;
0-l3*sin(theta3)-l4*sin(theta4)1;
0l3*cos(theta3)l4*cos(theta4)0];
B=[-l1*sin(theta1);
l1*cos(theta1);
0;
0];
omega=A\(omega1*B);
v3=omega
(1);
omega3=omega
(2);
omega4=omega(3);
vc=omega(4);
%计算连杆3、连杆4的角加速度,滑块2及C点的加速度
At=[-sin(theta3)-v3*sin(theta3)-S3*omega3*cos(theta3)-l4*omega4*cos(theta4)0;
cos(theta3)v3*cos(theta3)-S3*omega3*sin(theta3)-l4*omega4*sin(theta4)0;
0-l3*omega3*cos(theta3)-l4*omega4*cos(theta4)0;
0-l3*omega3*sin(theta3)-l4*omega4*sin(theta4)0];
Bt=[-l1*omega1*cos(theta1);
-l1*omega1*sin(theta1);
alpha=A\(-At*omega+alpha1*B+omega1*Bt);
a3=alpha
(1);
alpha3=alpha
(2);
alpha4=alpha(3);
ac=alpha(4);
(3)主程序
%%%%%%%%%%%%%%%%%%%%%%%%%%%%%%%%%%%%%%%%%%
%牛头刨床机构运动分析
%%
%输入已知数据
clear;
l1=;
l3=;
l4=;
h=;
h1=;
h2=;
omega1=5;
alpha1=0;
hd=pi/180;
du=180/pi;
theta0=[;
60*hd;
270*hd;
];
%调用子函数Six_Bar计算牛头刨床机构位移,角速度,角加速度
forn1=1:
459
theta1(n1)=-2*pi++(n1-1)*hd;
[theta,omega,alpha]=Six_Bar(theta0,theta1(n1),omega1,alpha1,h,h1,h2,l1,l3,l4);
S3(n1)=theta
(1);
%滑块2相对于CD杆的位移
theta3(n1)=theta
(2);
%杆3转过的角度
theta4(n1)=theta(3);
%杆4转过的角度
Sc(n1)=theta(4);
%杆5的位移
v3(n1)=omega
(1);
%滑块2相对于CD杆的速度
omega3(n1)=omega
(2);
%杆3转过的角速度
omega4(n1)=omega(3);
%杆4转过的角速度
vc(n1)=omega(4);
%杆5的速度
a3(n1)=alpha
(1);
%滑块2相对于CD杆的加速度
alpha3(n1)=alpha
(2);
%杆3转过的角加速度
alpha4(n1)=alpha(3);
%杆4转过的角加速度
ac(n1)=alpha(4);
%杆5的加速度
theta0=theta;
thetaOmegaAlpha=[theta3'
*du,theta4'
*du,Sc'
omega3'
omega4'
vc'
alpha3'
alpha4'
ac'
xlswrite('
'
thetaOmegaAlpha,'
sheet1'
'
b1:
j459'
);
%位移,角速度,角加速度和四杆机构图形输出
figure
(1);
n1=1:
459;
t=(n1-1)*2*pi/360;
%绘角位移和位移线图
subplot(2,2,1);
plot(t,theta3*du,'
r-.'
LineWidth'
;
holdon;
gridon;
axisauto;
[haxes,hline1,hline2]=plotyy(t,theta4*du,t,Sc);
set(hline1,'
set(hline2,'
title('
位移线图'
xlabel('
时间/s'
axes(haxes
(1));
ylabel('
角位移/\circ'
axes(haxes
(2));
位移/m'
text,,'
\theta_3'
text(3,,'
\theta_4'
text(5,,'
S_c'
%绘角速度及速度线图
subplot(2,2,2);
plot(t,omega3,'
[haxes,hline1,hline2]=plotyy(t,omega4,t,vc);
角速度线图'
角速度/rad\cdots^{-1}'
速度/m\cdots^{-1}'
\omega_3'
\omega_4'
v_c'
%绘角加速度和加速度线图
subplot(2,2,3);
plot(t,alpha3,'
[haxes,hline1,hline2]=plotyy(t,alpha4,t,ac);
角加速度线图'
角加速度/rad\cdots^{-2}'
加速度/m\cdots^{-2}'
\alpha_3'
\alpha_4'
a_c'
%绘制牛头刨床机构
subplot(2,2,4);
n1=20;
x
(1)=0;
y
(1)=0;
x
(2)=l4*1000*cos(theta4(n1));
y
(2)=l4*1000*sin(theta4(n1));
x(3)=l4*1000*cos(theta4(n1))+(S3(n1)*1000-50)*cos(theta3(n1));
y(3)=l4*1000*sin(theta4(n1))+(S3(n1)*1000-50)*sin(theta3(n1));
x(4)=h2*1000;
y(4)=h1*1000;
x(5)=x(4)+l1*1000*cos(theta1(n1));
y(5)=y(4)+l1*1000*sin(theta1(n1));
x(6)=x(3)+100*cos(theta3(n1));
y(6)=y(3)+100*sin(theta3(n1));
x(7)=l4*1000*cos(theta4(n1))+l3*1000*cos(theta3(n1));
y(7)=l4*1000*sin(theta4(n1))+l3*1000*sin(theta3(n1));
x(8)=x(7)-900;
y(8)=h*1000;
x(9)=x(7)+600;
y(9)=h*1000;
x(10)=l4*1000*cos(theta4(n1))+(S3(n1)*1000-50)*cos(theta3(n1));
y(10)=l4*1000*sin(theta4(n1))+(S3(n1)*1000-50)*sin(theta3(n1));
x(11)=x(10)+25*cos(pi/2-theta3(n1));
y(11)=y(10)-25*sin(pi/2-theta3(n1));
x(12)=x(11)+100*cos(theta3(n1));
y(12)=y(11)+100*sin(theta3(n1));
x(13)=x(12)-50*cos(pi/2-theta3(n1));
y(13)=y(12)+50*sin(pi/2-theta3(n1));
x(14)=x(10)-25*cos(pi/2-theta3(n1));
y(14)=y(10)+25*sin(pi/2-theta3(n1));
x(15)=x(10);
y(15)=y(10);
x(16)=0;
y(16)=0;
x(17)=x(4);
y(17)=y(4);
k=1:
3;
plot(x(k),y(k));
k=4:
5;
k=6:
9;
k=10:
15;
k=16:
17;
plot(x(k),y(k),'
-.'
axis([-350800-250950]);
牛头刨床运动仿真'
mm'
plot(x
(1),y
(1),'
o'
plot(x
(2),y
(2),'
plot(x(4),y(4),'
plot(x(5),y(5),'
plot(x(7),y(7),'
%牛头刨床机构运动仿真
figure
(2)
m=moviein(20);
j=0;
5:
j=j+1;
clf;
x
(1)=0;
y
(1)=0;
x
(2)=l4*1000*cos(theta4(n1));
y
(2)=l4*1000*sin(theta4(n1));
x(3)=l4*1000*cos(theta4(n1))+(S3(n1)*1000-50)*cos(theta3(n1));
y(3)=l4*1000*sin(theta4(n1))+(S3(n1)*1000-50)*sin(theta3(n1));
x(4)=h2*1000;
y(4)=h1*1000;
x(5)=x(4)+l1*1000*cos(theta1(n1));
y(5)=y(4)+l1*1000*sin(theta1(n1));
x(6)=x(3)+100*cos(theta3(n1));
y(6)=y(3)+100*sin(theta3(n1));
x(7)=l4*1000*cos(theta4(n1))+l3*1000*cos(theta3(n1));
y(7)=l4*1000*sin(theta4(n1))+l3*1000*sin(theta3(n1));
x(8)=x(7)-900;
y(8)=h*1000;
x(9)=x(7)+600;
y(9)=h*1000;
x(10)=l4*1000*cos(theta4(n1))+(S3(n1)*1000-50)*cos(theta3(n1));
y(10)=l4*1000*sin(theta4(n1))+(S3(n1)*1000-50)*sin(theta3(n1));
x(11)=x(10)+25*cos(pi/2-theta3(n1));
y(11)=y(10)-25*sin(pi/2-theta3(n1));
x(12)=x(11)+100*cos(theta3(n1));
y(12)=y(11)+100*sin(theta3(n1));
x(13)=x(12)-50*cos(pi/2-theta3(n1));
y(13)=y(12)+50*sin(pi/2-theta3(n1));
x(14)=x(10)-25*cos(pi/2-theta3(n1));
y(14)=y(10)+25*sin(pi/2-theta3(n1));
x(15)=x(10);
y(15)=y(10);
x(16)=0;
y(16)=0;
x(17)=x(4);
y(17)=y(4);
k=1:
plot(x(k),y(k));
holdon;
k=4:
k=6:
k=10:
k=16:
plot(x(k),y(k),'
gridon;
axis([-350800-250950]);
title('
xlabel('
ylabel('
plot(x
(1),y
(1),'
plot(x
(2),y
(2),'
plot(x(4),y(4),'
plot(x(5),y(5),'
plot(x(7),y(7),'
axisequal;
m(j)=getframe;
fori=1:
3
movie(m)
end
 升级会员
升级会员 