assignment for accountingWord格式.docx
《assignment for accountingWord格式.docx》由会员分享,可在线阅读,更多相关《assignment for accountingWord格式.docx(7页珍藏版)》请在冰豆网上搜索。
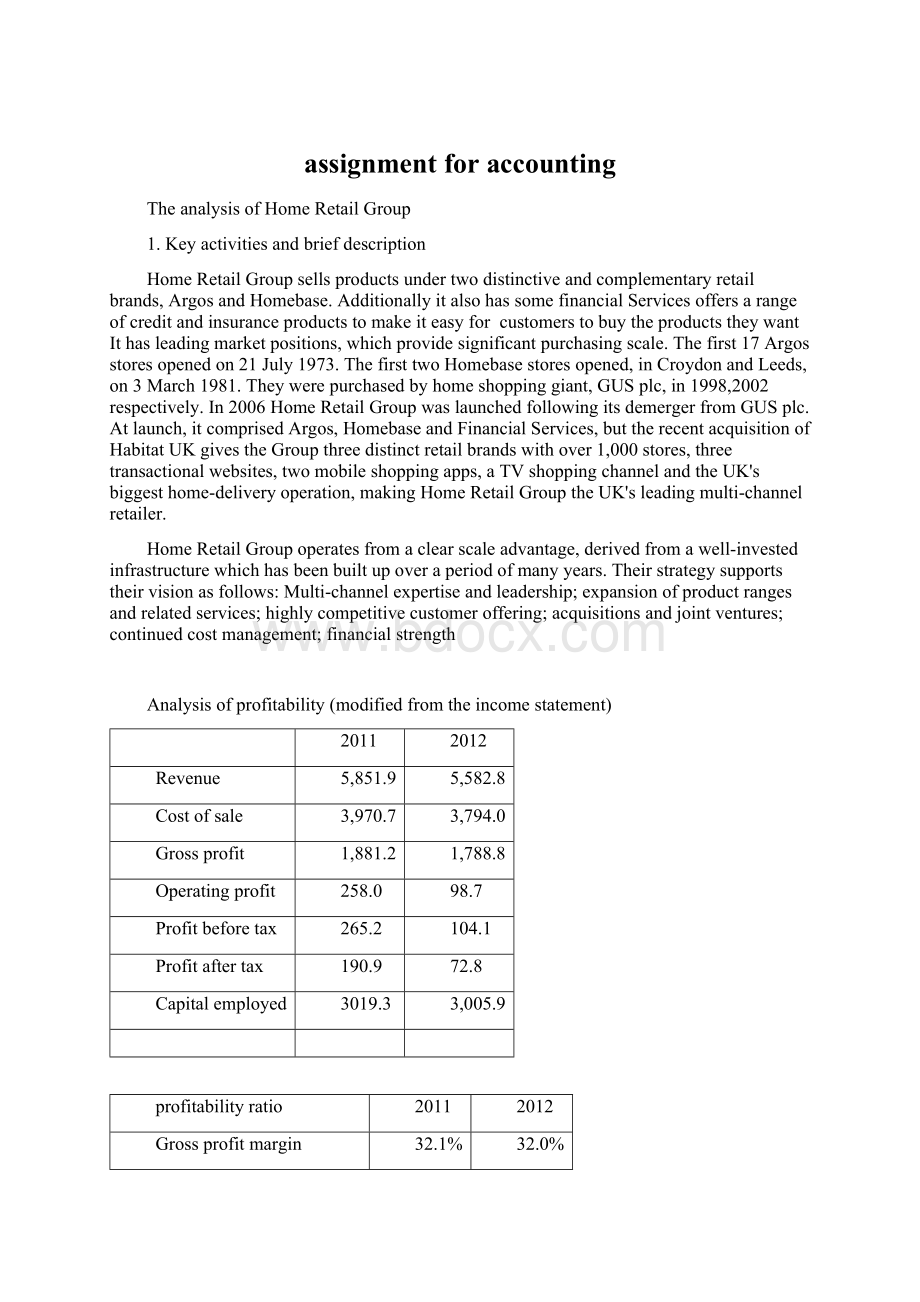
Costofsale
3,970.7
3,794.0
Grossprofit
1,881.2
1,788.8
Operatingprofit
258.0
98.7
Profitbeforetax
265.2
104.1
Profitaftertax
190.9
72.8
Capitalemployed
3019.3
3,005.9
profitabilityratio
Grossprofitmargin
32.1%
32.0%
Operatingprofitmargin
4.4%
1.7%
Pre-taxprofitmargin
4.5%
1.9%
Post-taxprofitmargin
3.3%
1.3%
Returnoncapitalemployed
8.5%
Returnonequity
7.0%
2.8%
Theprofitabilitythisyearisworsethanlastyear.
Thegrossprofitmargindecreaseslightly.Becausethefinancialcrisis,onthefactthatworking-classfamilieswerehammeredbytherecessionandhaven'
tgotoutofit.Theyreducetheconsumptionevenundersomeofthepromotionalactivities.Thereforrevenuedropsby4.6%from2011to2012,thecostofsaleincreaseby4.45%atthesametime.Butoverall,thegrossprofitmarginishighstillmorethan30%.
Intherespectoftheoperatingprofitmargin,thefigurefluctuatealot,whichdecreasefrom4.4%to1.7%.ThebigerosionofGPMcomesfromthesellingcosts,whichisabigandimportantpartofretailindustry.Additionally,theadministrativecostsincreasemorethan10%,whichthemainfactorsthatleadtoagreatincreaseintotalnetoperatingexpenseanddecreasetheoperatingprofitmargin.Inthiscase,itisnotagoodopportunityformanagementinvestorstoinvestthiscompany.Sothecompanyneedstocontrolthecostofsaleandadministrationaswellasincreasethecompetitiontogetthemostmarketsharetoincreaserevenueandimprovetheprofitability.
Thepre-taxprofitmargindeclinesfrom4.5%to1.9%,whichduetothedecreaseoffinanceincomeismorethantheincreaseoffinanceexpense.ThePostTPMalsodropsfrom3.3%to1.3%althoughthetaxexpensefellbyover£
33.
ROEandROCEaretwoimportantratios,whiletheydropfrom7%to2.8%and8.5%to3.3%respectively.Thecapitalemployeddecrease44%from2011to2012,becauseequitydecreasesmorethanborrowingsincrease.ROEalsodecreases,whichmeanslessprofitisavailabletoshareholdersasdividends.
Equityinvestorsshouldanalysisinvestmentratio
Figurescanbeseenformthetable:
Earningspershare
23.1
9.1
Dividendpershare
14.2
4.7
Dividendcover
1.626760563
1.93617
Dividendyield
1.10383536
0.500332668
Priceearningsratio
3.253246753
11.74725275
Althoughthenumberofshareholdershasdecreasenearly3.5%theEPShasreducedfrom£
23.1to£
9.1.Themostimportantreasonisthedropofprofit.Itisabadnewsforequityinvestors.
Dividendpershare2012almosthalfofthatin2011,notonlybecausein2012theBoardofDirectorsdoesnotrecommendafinaldividendinrespectoftheyearended3March2012,butalsoduetothefewerinterimdividend.Thisfiguremeansinvestorswillgetfewerdividendsfromthe
Thedividendcoverincreasefrom1.6to1.9,itmeanstheabilitytopaydividendsbecomestronger.Butduetothelimitationofratioanalysisandthesituationofdividendsdistribution,
Liquidityratio
currentasset
1,898.70
1,731.20
currentliability
1,118.50
1,002.70
inventory
1,016.80
933.2
tradepayable
58.70
55.8
costofsale
3,970.70
3,794.00
currentratio
1.69754135
1.726538346
liquidratio
0.788466696
0.795851202
inventorydays
93.46765054
89.77807064
Tradepayabledays
45.90651522
45.74525567
Tradereceivabledays
31.66672363
32.22549617
Toanalysisthefinancialpositionofthiscompany,bothcurrentratioandliquidratioincreasedwhichmeanstheshorttermdebtpayingabilityincreased.Theliquidratioislessthan1,mainlybecauseofthelargenumberofinventoriesforresale.
Theinventorydaysdecreasefrommorethan93daysin2011toabout90daysin2012,itisalittlehigh,anddonotmatchthe“justintime”principle,butitstillcanbeacceptbecauseofthewholesaleandretailindustry.Largeinventoriesincreasethecostofstoreandmanagementbutitprovidesenoughchoicesforcustomersandensuresthemarketsharetocertainextent.
Tradepayabledaysin2012almostthesameasthatin2011.Oneandahalfmonthlessthanperiodoftradereceivabledays,whichmeansthecompanycanusethetradereceivabletomeetthetradepayableandlesstheuseofcash.
Gearingratio
Debttoequity
Netdebttoequity
-0.07400777
-0.058113235
Interestcover
5.139442231
2.039256198
Netinterestcover
Thedebttoequitydropsfrom14.49%to10.15%whichmeansthatthecompanyrelieslessonthemoneyfromborrowing.Thedecreaseindicatesthatthecompany’slong-termdebtpayingabilityimproved.
Netdebttoequityislessthandebttoequitybecauseofthedeductionofcashfromthenon-currentliabilities.Thisratiodecreasesfrom7.09%in2011to4.33%in2012andthedeviationfromlastyearmeansthelowerriskofthebusinessfailingin2012.
WhenitcomestoInterestcover,thedecreaseofthisratiodemonstratethattheabilitytopaytheinterestbecomeweakerandthedecreaseofprofitabilityandstability.
Cashflowpershare
0.321785156
0.258558446
Thecashflowpershareshowsthepercentageofnetcashflowfromoperatingactivitiesandtotalnumberofequityshare.Althoughthetotalnumberofequitysharesdecrease,theratiostilldecrease,becausethenetcashflowfromoperatingactivitiesdropsmorethan20%.ThisratioismorethanEPS,duetothenetcashflowgeneratedbythecompany’snormaloperatingactivitiesalsoincludethecostsdeductedfromtheprofits,butdonotaffectthecashoutflowadjustments,suchasdepreciationcharges.Sothecashflowislessthantheprofit.CFPSindicatethehighestamountofcashdividends,whileEPScannotshowthisability.
Appendix:
Profitability:
1.Grossprofitmargin=grossprofit/revenue
2011:
=1,881.20/5,851.90=0.321
2012:
=1,788.80/5,582.80=0.320
2.Operatingprofitmargin=operatingprofit/revenue
=258/5,851.90=0.044
=98.7/5,582.80=0.018
3.pre-taxprofitmargin=pre-taxprofit/revenue
=265.2/5,851.90=0.045
=104.1/5,582.80=0.019
4.post-taxprofitmargin=post-taxprofit/revenue
=190.9/5,851.90=0.033
=72.8/5,582.80=0.013
5.Returnoncapitalemployed=operatingprofit/totalcapitalemployed
=258/3,019.3=0.085
=98.7/3,005.9=0.033
6.Returnonequity=profitaftertax/equity
=190.9/2,741.20=0.070
=72.8/2,625.4=0.028
Investmentratio
1.Earningspershare(EPS)=profitaftertax/totalnumberofequityshares*100
=23.1
=9.1
1.Dividendpershare(DPS)itisgiven
2011:
=(38.1+79.9)/831.3=14.2pperordinaryshare
=37.6/803.3=4.7pperordinaryshare.
2.Dividendcover(DC)=EPS/DPS
=23.1/14.2=1.626760563
=9.1/4.7=1.93617
3.Dividendyield=totaldividend/currentmarketprice*100
ThecurrentmarketpricecangetfromtheLondonexchangestockwhichis106.90for22Nov2012
Thecurrentmarketpricefor22Nov2011cangetformhistoricalpriceYAHOOfinance,whichwas75.15.
=118/106.90=1.10383536
=37.6/75.15=0.500332668
4.PriceEarningsratio=currentmarketprice/EPS
=75.15/23.1=3.253246753
=106.90/9.1=11.74725275
Liquidity
1.Currentratio=currentasset/currentliability=
=1,898.70/1,118.50=1.69754135
=1,731.20/1,002.70=1.7265383
2.Liquidratio=(currentasset-inventory)/currentliability=
=881.9/1,118.50=0.788466696
=798.0/1,002.70=0.7958512
3.Inventorydays=(inventory/costofsales)*365
=(1,016.80/3,970.70)*365=93.46765054
=(933.2/3,794.00)*365=89.778071
4.Tradereceivabledays=tradereceivables/revenue*365
=507.7/5,851.90*365=31.66672363
=492.9/5,582.80*365=32.22549617
5.tradepayablesdays=(tradepayables/costofsales)*365
=499.4/3,970.70*365=45.90651522
=475.5/3,794.00*365=45.74525567
Gearing
1.debttoequity=non-currentborrowings/equity*100
=0/2,625.4=0
=0/2,741.2=0
2.Netdebtequity=Borrowingslesscash/Totalequity
=(0-194.3)/2,625.4=-0.07400777
=(0-159.3)/2,741.2=-0.058113235
3.Interestcover=operatingprofit/interest
=258/50.2=5.139442
 升级会员
升级会员 