剑桥雅思真题小作文题目分类总结48Word文件下载.docx
《剑桥雅思真题小作文题目分类总结48Word文件下载.docx》由会员分享,可在线阅读,更多相关《剑桥雅思真题小作文题目分类总结48Word文件下载.docx(13页珍藏版)》请在冰豆网上搜索。
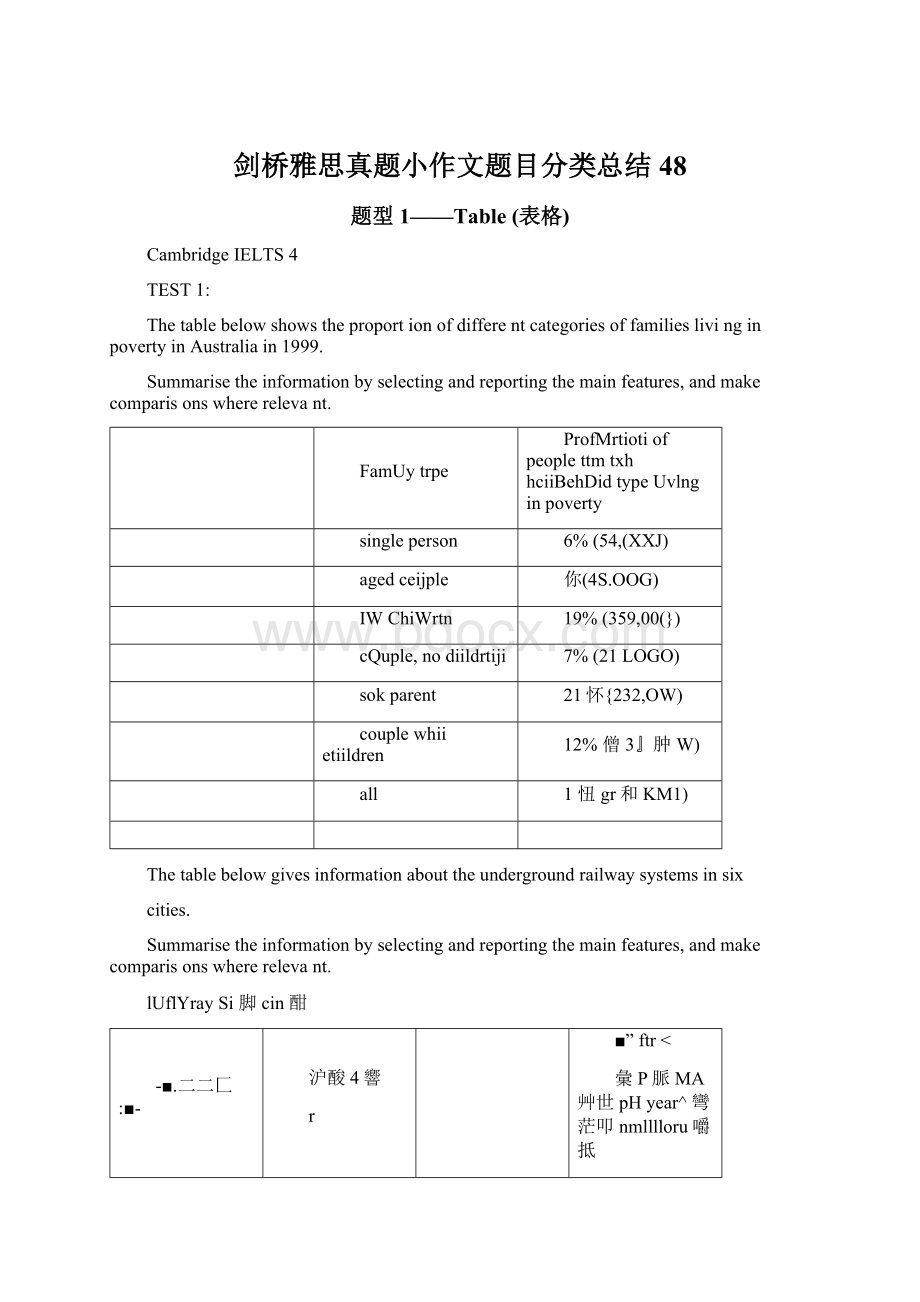
couplewhiietiildren
12%僧3』肿W)
all
1忸gr和KM1)
Thetablebelowgivesinformationabouttheundergroundrailwaysystemsinsix
cities.
lUflYraySi脚cin酣
-■.二二匚:
■-
沪酸4響
r
■”ftr<
彙P脈MA艸世pHyear^彎茫叩nmlllloru嚼抵
E^ndon
1师3
775
PnriS
1900
tw?
I'
nkyo
1927
155
Wfi!
$hbgloi9T1C
1976
126
144
Kyoio
1処I
11
-■■
l加An輕1味
2001
2K
dlsinrLcehiiikilch1ravellofperpersonperbymoduo(travel
MRS
200D
Wiilking
出
231
Hicypfc
31
41
Car
3,IW>
钳06
14KIIIIhi、
C9
21A
IjMigdiktfiiirobm
54
124
Eh
聊
166
1■对
I]
42
Cither
430
5K3
4,740
Thetablebelowgivesinformationonconsumerspendingondifferentitemsinfivedifferentcountriesin2002.
Pcreenrageofnutioiulconsumerexpwiditijrcbycategoty-J<
M>
2
('
rraiirn
Is呱喩师
Ihthi瞩卜
1
221%
Ml,
IU6%
3:
阿
和・ln
6JI%
l生77%
罠航1
32TA
rZ"
■
ni4!
<
6.63%
4397,
题型2——LineGraph(线性图)
CambridgeIELTS5
Thegraphblewshowstheproportionofthepopulationaged65andoverbetween
1940and2040inthreedifferentcountries.
Summariestheinformationbyselectingandreportingthemainfeatures,andmakecomparisonswhererelevant.
%Proportionofpopalatioa2閑165andm
SxvetlenUSA
TheparghbelowshowstheconsumptionoffishandsomedifferentkindsofmeatinEuropeancountrybetween1979and2004.
Fishandmealconsumption
300-i
250
197919841989199419992004
ThegraphbelowshowsthequantitiesofgoodstransportintheUKbetween1974and2002byfourdifferentmodesoftransport.
Summarisetheinformationbyselectingandreportingthemainfeaturesandmakecomparisonswhererelevant.
51'
一一吉匚口='
-.』
题型3——BarChart(条形图/柱状图)
TEST3:
Thechartbelowshowsthedifferentlevelsofpost-schoolqualificationsinAustraliaandtheproportionofmenandwomenwhoheldthemin1999.
Post-schoolInAustrftlilHnqrdingIOBernierI099
Thechartsbelowshowthemainreasonsforstudyamongstudentsofdifferentagegroupsandamountofsupporttheyreceivedfromemployers.
(hrshidylicvnnHngtuMvdcul
1IfirtiffcrIE!
ForIntend
Mjppnrby评(TimeolTmidhelpvvirh
Numberofinturriiigea;
kiiddivortw;
in(heUS禹
1970-2000
■Mirrj
口"
iwivm
MaritulsdutnsDfudultAmericjHi5,197(*^nd21)00
Percemagechangeinhoiist卩rku&
in(iyccities
LWO二002compaiedwkh19泗
Wfi-?
OO2
id
average
fernye
5
■N亡wYork(USA)■M:
idnd审挑tri*ffiTcR丫心卩彳宙!
)〕
口I"
口上忖昨1*[叩遑円外<
UK)
题型4——PieChart(饼图)
CambridgeIELTS7
TEST4:
ThepiechartsbelowshowunitsofelectricityproductionbyfuelsourceinAustraliaandFrancein1980and2000.
l:
niauf曲byKMircttn\usfralia
CambridgeIELTS8
TEST2:
ThethreepiechartsbelowshowthechangesinannualspendingbyaparticularUKschoolin1981,1991,and2001.
TotalSchoolSpending
TotalSchoolSpending1991
Otherwofkerssaiane^3S%
TotalSchoolSpending2001
Furrtlure^nd
WlLtipmcnt
23%
题型5――混合图
ThegraphblewshowsthedemandelectricityinEngliandduringtypicaldaysinwinter
andsummer.ThepiechartshowshowelectricityisusedinanaverageEnglishhome.Summarisetheinformationbyselectingandreportingthemainfeaturesand
makecomparisionswhereralevant.
—J
fl
晖片*IIpallngrvoraM,im.b*
3)Ua^YlkiD,TV.fl
lQiWV*CU_netMTW*,AdCKT«
*«
CU*C
ThechartsbelowgiveinformationabouttraveltoandfromtheUK,andaboutthemostpopularcountriesf
 升级会员
升级会员 