雅思小作文之图表作文文档格式.docx
《雅思小作文之图表作文文档格式.docx》由会员分享,可在线阅读,更多相关《雅思小作文之图表作文文档格式.docx(8页珍藏版)》请在冰豆网上搜索。
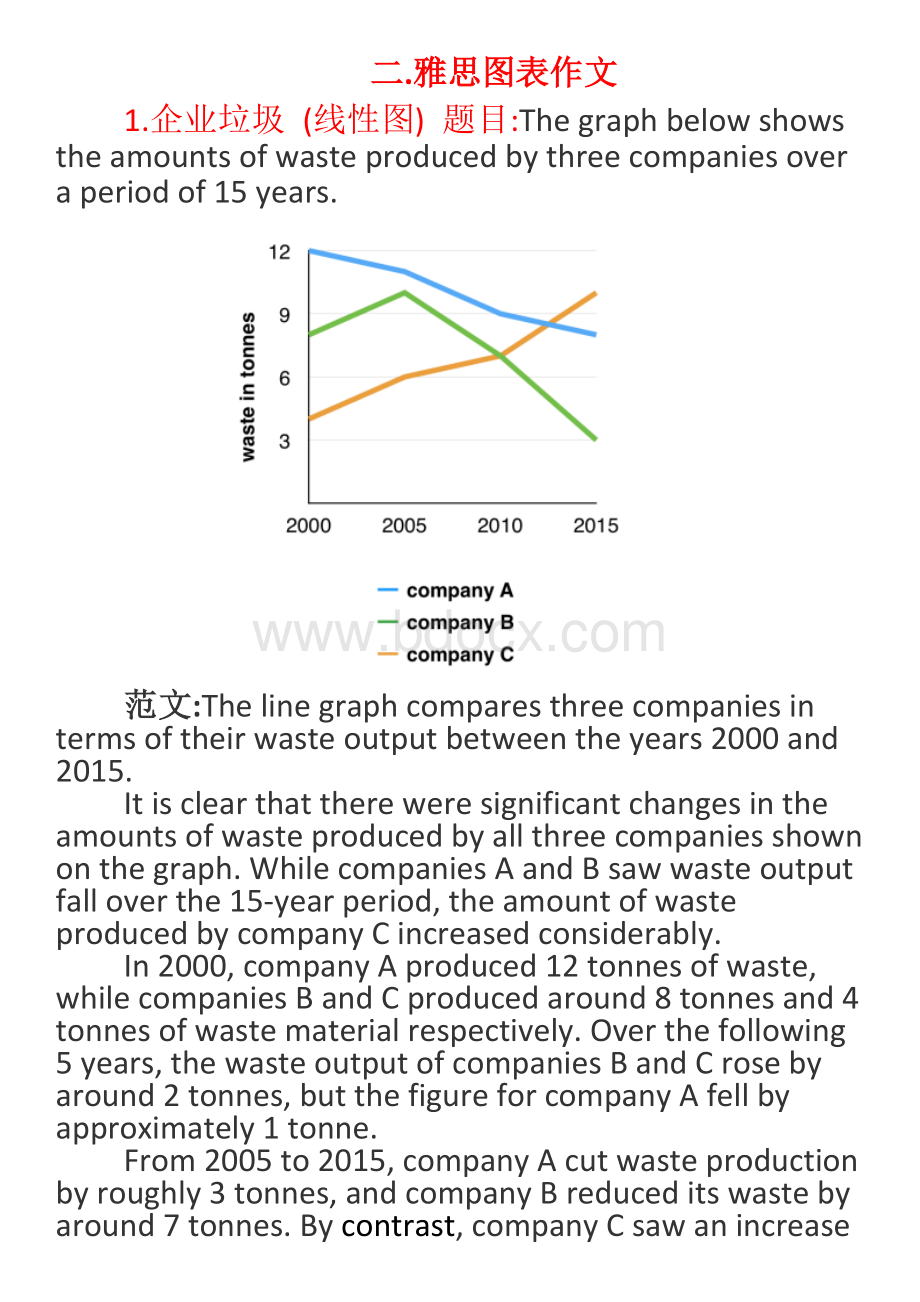
Thelinegraphcomparesthreecompaniesintermsoftheirwasteoutputbetweentheyears2000and2015.
Itisclearthatthereweresignificantchangesintheamountsofwasteproducedbyallthreecompaniesshownonthegraph.WhilecompaniesAandBsawwasteoutputfalloverthe15-yearperiod,theamountofwasteproducedbycompanyCincreasedconsiderably.
In2000,companyAproduced12tonnesofwaste,whilecompaniesBandCproducedaround8tonnesand4tonnesofwastematerialrespectively.Overthefollowing5years,thewasteoutputofcompaniesBandCrosebyaround2tonnes,butthefigureforcompanyAfellbyapproximately1tonne.
From2005to2015,companyAcutwasteproductionbyroughly3tonnes,andcompanyBreduceditswastebyaround7tonnes.Bycontrast,companyCsawanincreaseinwasteproductionofapproximately4tonnesoverthesame10-yearperiod.By2015,companyC’swasteoutputhadrisento10tonnes,whiletherespectiveamountsofwastefromcompaniesAandBhaddroppedto8tonnesandonly3tonnes.(192words,band9)
这条线图对三家公司的废物产出从2000年到2015年进行了比较。
很明显,图表上显示的这三家公司生产的垃圾量发生了重大变化。
虽然A公司和B公司在15年的时间里看到了废物的产量下降,但C公司生产的废物量却大幅增加。
2000年,A公司生产了12吨废物,而B公司和C公司分别生产了大约8吨和4吨废料。
在接下来的5年里,公司B和C的废料产量增加了大约2吨,但是公司A的产量下降了大约1吨。
从2005年到2015年,公司将废物产量减少了大约3吨,公司B减少了大约7吨的垃圾。
相比之下,C公司在同样的10年时间里,废物产量增加了大约4吨。
到2015年,C公司的废物产量已升至10吨,而A和B公司的垃圾量已降至8吨,仅为3吨。
2.游客分析(饼图)题目:
ThechartbelowshowstheresultsofasurveyofpeoplewhovisitedfourtypesoftouristattractioninBritainintheyear1999.
ThepiechartcomparesfiguresforvisitorstofourcategoriesoftouristattractionandtofivedifferentthemeparksinBritainin1999.
Itisclearthatthemeparksandmuseums/gallerieswerethetwomostpopulartypesoftouristattractioninthatyear.BlackpoolPleasureBeachreceivedbyfarthehighestproportionofvisitorsinthethemeparksector.
Lookingattheinformationinmoredetail,wecanseethat38%ofthesurveyedvisitorswenttoathemepark,and37%ofthemwenttoamuseumorgallery.Bycontrast,historichousesandmonumentswerevisitedbyonly16%ofthesample,whilewildlifeparksandzoosweretheleastpopularofthefourtypesoftouristattraction,withonly9%ofvisitors.
Inthethemeparksector,almosthalfofthepeoplesurveyed(47%)hadbeentoBlackpoolPleasureBeach.AltonTowerswasthesecondmostpopularamusementpark,with17%ofthesample,followedbyPleasurelandinSouthport,with16%.Finally,ChessingtonWorldofAdventuresandLegolandWindsorhadeachwelcomed10%ofthesurveyedvisitors.(181words,band9)
这个饼状图比较了1999年英国的四类旅游景点和5个不同主题公园的游客人数。
很明显,主题公园和博物馆/画廊是那一年最受欢迎的两种旅游景点。
在主题公园中,黑潭快乐海滩获得的游客比例是最高的。
更详细地看这些信息,我们可以看到,38%的受访游客去了一个主题公园,其中37%的人去了博物馆或美术馆。
相比之下,只有16%的样本参观了历史建筑和纪念碑,而野生动物公园和动物园则是这四种旅游景点中最不受欢迎的,只有9%的游客。
在主题公园领域,几乎一半的被调查者(47%)曾经到过布莱克浦的快乐海滩。
奥尔顿塔是第二大最受欢迎的游乐园,有17%的样本,其次是在索斯波特的娱乐公园,占16%。
最后,查辛顿冒险世界和乐高和温莎的游客都欢迎10%的游客。
3.各地房价(饼图)题目:
Thechartbelowshowsinformationaboutchangesinaveragehousepricesinfivedifferentcitiesbetween1990and2002comparedwiththeaveragehousepricesin1989.
范文:
hebarchartcomparesthecostofanaveragehouseinfivemajorcitiesoveraperiodof13yearsfrom1989.
Wecanseethathousepricesfelloverallbetween1990and1995,butmostofthecitiessawrisingpricesbetween1996and2002.Londonexperiencedbyfarthegreatestchangesinhousepricesoverthe13-yearperiod.
Overthe5yearsafter1989,thecostofaveragehomesinTokyoandLondondroppedbyaround7%,whileNewYorkhousepriceswentdownby5%.Bycontrast,pricesrosebyapproximately2%inbothMadridandFrankfurt.
Between1996and2002,Londonhousepricesjumpedtoaround12%abovethe1989average.HomebuyersinNewYorkalsohadtopaysignificantlymore,withpricesrisingto5%abovethe1989average,buthomesinTokyoremainedcheaperthantheywerein1989.ThecostofanaveragehomeinMadridrosebyafurther2%,whilepricesinFrankfurtremainedstable.(165words)
柱状图比较了从1989年开始的13年里,五个主要城市的平均房价。
我们可以看到,在1990年至1995年期间,房价总体下跌,但大多数城市在1996年至2002年期间房价上涨。
在过去的13年里,伦敦经历了房价的最大变化。
在1989年之后的5年里,东京和伦敦的平均房价下跌了7%,而纽约房价下跌了5个百分点。
相比之下,马德里和法兰克福的房价都上涨了大约2个百分点。
从1996年到2002年,伦敦房价跳涨到比1989年平均水平高出12个百分点。
纽约的购房者也不得不支付更高的价格,房价比1989年的平均水平高出5%,但东京的房价仍然低于1989年的水平。
在马德里,平均房价上涨了2%,而法兰克福的房价则保持稳定。
4.骑车上班(表格)题目:
ThetablebelowshowschangesinthenumbersofresidentscyclingtoworkindifferentareasoftheUKbetween2001and2011.
ThetablecomparesthenumbersofpeoplewhocycledtoworkintwelveareasoftheUKintheyears2001and2011.
Overall,thenumberofUKcommuterswhotravelledtoworkbybicycleroseconsiderablyoverthe10-yearperiod.InnerLondonhadbyfarthehighestnumberofcyclingcommutersinbo
 升级会员
升级会员 