Hypothesis Testing Basics.docx
《Hypothesis Testing Basics.docx》由会员分享,可在线阅读,更多相关《Hypothesis Testing Basics.docx(14页珍藏版)》请在冰豆网上搜索。

HypothesisTestingBasics
HypothesisTestingBasics
TheNormalDistribution
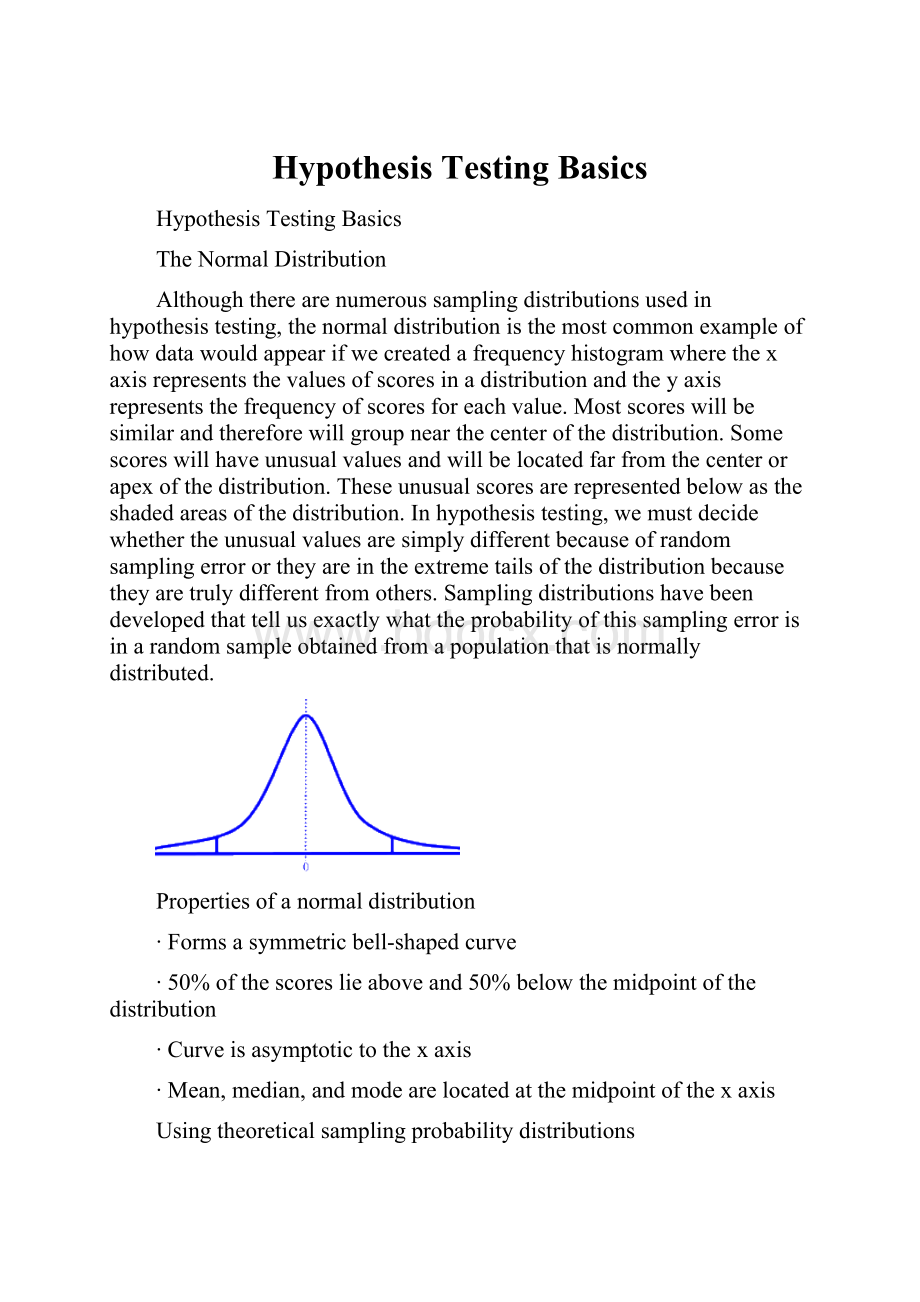
Althoughtherearenumeroussamplingdistributionsusedinhypothesistesting,thenormaldistributionisthemostcommonexampleofhowdatawouldappearifwecreatedafrequencyhistogramwherethexaxisrepresentsthevaluesofscoresinadistributionandtheyaxisrepresentsthefrequencyofscoresforeachvalue.Mostscoreswillbesimilarandthereforewillgroupnearthecenterofthedistribution.Somescoreswillhaveunusualvaluesandwillbelocatedfarfromthecenterorapexofthedistribution.Theseunusualscoresarerepresentedbelowastheshadedareasofthedistribution.Inhypothesistesting,wemustdecidewhethertheunusualvaluesaresimplydifferentbecauseofrandomsamplingerrorortheyareintheextremetailsofthedistributionbecausetheyaretrulydifferentfromothers.Samplingdistributionshavebeendevelopedthattellusexactlywhattheprobabilityofthissamplingerrorisinarandomsampleobtainedfromapopulationthatisnormallydistributed.
Propertiesofanormaldistribution
∙Formsasymmetricbell-shapedcurve
∙50%ofthescoreslieaboveand50%belowthemidpointofthedistribution
∙Curveisasymptotictothexaxis
∙Mean,median,andmodearelocatedatthemidpointofthexaxis
Usingtheoreticalsamplingprobabilitydistributions
Samplingdistributionsallowustoapproximatetheprobabilitythataparticularvaluewouldoccurbychancealone.Ifyoucollectedmeansfromaninfinitenumberofrepeatedrandomsamplesofthesamesamplesizefromthesamepopulationyouwouldfindthatmostmeanswillbeverysimilarinvalue,inotherwords,theywillgrouparoundthetruepopulationmean.Mostmeanswillcollectaboutacentralvalueormidpointofasamplingdistribution.Thefrequencyofmeanswilldecreaseasonetravelsawayfromthecenterofanormalsamplingdistribution.Inanormalprobabilitydistribution,about95%ofthemeansresultingfromaninfinitenumberofrepeatedrandomsampleswillfallbetween1.96standarderrorsaboveandbelowthemidpointofthedistributionwhichrepresentsthetruepopulationmeanandonly5%willfallbeyond(2.5%ineachtailofthedistribution).
Thefollowingarecommonlyusedpointsonadistributionfordecidingstatisticalsignificance:
90%ofscores+/-1.65standarderrors
95%ofscores+/-1.96standarderrors
99%ofscores+/-2.58standarderrors
Standarderror:
Mathematicaladjustmenttothestandarddeviationtoaccountfortheeffectsamplesizehasontheunderlyingprobabilitydistribution.Itrepresentsthestandarddeviationofthesamplingdistribution
Alphaandtheroleofthedistributiontails
Thepercentageofscoresbeyondaparticularpointalongthexaxisofasamplingdistributionrepresentthepercentofthetimeduringaninfinitenumberofrepeatedsamplesonewouldexpecttohaveascoreatorbeyondthatvalueonthexaxis.Thisvalueonthexaxisisknownasthecriticalvaluewhenusedinhypothesistesting.Themidpointrepresentstheactualpopulationvalue.Mostscoreswillfallneartheactualpopulationvaluebutwillexhibitsomevariationduetosamplingerror.Ifascorefromarandomsamplefalls1.96standarderrorsorfartheraboveorbelowthemeanofthesamplingdistribution,weknowfromtheprobabilitydistributionthatthereisonlya5%chanceofrandomlyselectingasetofscoresthatwouldproduceasamplemeanthatfarfromthetruepopulationmean.Whenconductingsignificancetesting,ifwehaveateststatisticthatis1.96standarderrorsaboveorbelowthemeanofthesamplingdistribution,weassumewehaveastatisticallysignificantdifferencebetweenoursamplemeanandtheexpectedmeanforthepopulation.Sinceweknowavaluethatfarfromthepopulationmeanwillonlyoccurrandomly5%ofthetime,weassumethedifferenceistheresultofatruedifferencebetweenthesampleandthepopulationmean,andisnottheresultofrandomsamplingerror.The5%isalsoknownasalphaandistheprobabilityofbeingwrongwhenweconcludestatisticalsignificance.
1-tailedvs.2-tailedstatisticaltests
A2-tailedtestisusedwhenyoucannotdetermineaprioriwhetheradifferencebetweenpopulationparameterswillbepositiveornegative.A1-tailedtestisusedwhenyoucanreasonablyexpectadifferencewillbepositiveornegative.Ifyouretainthesamecriticalvaluefora1-tailedtestthatwouldbeusedifa2-tailedtestwasemployed,thealphaishalved(i.e.,.05alphawouldbecome.025alpha).
HypothesisTesting
Thechainofreasoningandsystematicstepsusedinhypothesistestingthatareoutlinedinthissectionarethebackboneofeverystatisticaltestregardlessofwhetheronewritesouteachstepinaclassroomsettingorusesstatisticalsoftwaretoconductstatisticaltestsonvariablesstoredinadatabase.
Chainofreasoningforinferentialstatistics
1.Sample(s)mustberandomlyselected
2.Sampleestimateiscomparedtounderlyingdistributionofthesamesizesamplingdistribution
3.Determinetheprobabilitythatasampleestimatereflectsthepopulationparameter
Thefourpossibleoutcomesinhypothesistesting
ActualPopulationComparison
NullHyp.True
NullHyp.False
DECISION
(thereisnodifference)
(thereisadifference)
RejectedNullHyp
TypeIerror
(alpha)
CorrectDecision
DidnotRejectNull
CorrectDecision
TypeIIError
(Alpha=probabilityofmakingaTypeIerror)
Regardlessofwhetherstatisticaltestsareconductedbyhandorthroughstatisticalsoftware,thereisanimplicitunderstandingthatsystematicstepsarebeingfollowedtodeterminestatisticalsignificance.Thesegeneralstepsaredescribedonthefollowingpageandinclude1)assumptions,2)statedhypothesis,3)rejectioncriteria,4)computationofstatistics,and5)decisionregardingthenullhypothesis.Theunderlyinglogicisbasedonrejectingastatementofnodifferenceornoassociation,calledthenullhypothesis.Thenullhypothesisisonlyrejectedwhenwehaveevidencebeyondareasonabledoubtthatatruedifferenceorassociationexistsinthepopulation(s)fromwhichwedrewourrandomsample(s).
Reasonabledoubtisbasedonprobabilitysamplingdistributionsandcanvaryattheresearcher'sdiscretion.Alpha.05isacommonbenchmarkforreasonabledoubt.Atalpha.05weknowfromthesamplingdistributionthatateststatisticwillonlyoccurbyrandomchancefivetimesoutof100(5%probability).Sinceateststatisticthatresultsinanalphaof.05couldonlyoccurbyrandomchance5%ofthetime,weassumethattheteststatisticresultedbecausetherearetruedifferencesbetweenthepopulationparameters,notbecausewedrewanextremelybiasedrandomsample.
Whenlearningstatisticswegenerallyconductstatisticaltestsbyhand.Inthesesituations,weestablishbeforethetestisconductedwhatteststatisticisneeded(calledthecriticalvalue)toclaimstatisticalsignificance.So,ifweknowforagivensamplingdistributionthatateststatisticofplusorminus1.96wouldonlyoccur5%ofthetimerandomly,anyteststatisticthatis1.96orgreaterinabsolutevaluewouldbestatisticallysignificant.Inananalysiswhereateststatisticwasexactly1.96,youwouldhavea5%chanceofbeingwrongifyouclaimedstatisticalsignificance.Iftheteststatisticwas3.00,statisticalsignificancecouldalsobeclaimedbuttheprobabilityofbeingwrongwouldbemuchless(about.002ifusinga2-tailedtestortwo-tenthsofonepercent;0.2%).Both.05and.002areknownasalpha;theprobabilityofaTypeIerror.
Whenconductingstatisticaltestswithcomputersoftware,theexactprobabilityofaTypeIerroriscalculated.Itispresentedinseveralformatsbutismostcommonlyreportedas"p<"or"Sig."or"Signif."or"Significance."Using"p<"asanexample,ifaprioriyouestablishedathresholdforstatisticalsignificanceatalpha.05,anyteststatisticwithsignificanceatorlessthan.05wouldbeconsideredstatisticallysignificantandyouwouldberequiredtorejectthenullhypothesisofnodifference.Thefollowingtablelinkspvalueswithabenchmarkalphaof.05:
P<
Alpha
ProbabilityofTypeIError
FinalDecision
.05
.05
5%chancedifferenceisnotsignificant
Statisticallysignificant
.10
.05
10%chancedifferenceisnotsignificant
Notstatisticallysignificant
.01
.05
1%chancedifferenceisnotsignificant
Statisticallysignificant
.96
.05
96%chancedifferenceisnotsignificant
Notstatisticallysignificant
StepstoHypothesisTesting
Hypothesistestingisusedtoestablishwhetherthedifferencesexhibitedbyrandomsamplescanbeinferredtothepopulationsfromwhichthesamplesoriginated.
GeneralAssumptions
∙Populationisnormallydistributed
∙Randomsampling
∙Mutuallyexclusivecomparisonsamples
∙Datacharacteristicsmatchstatisticaltechnique
Forinterval/ratiodatauseÊ
t-tests,Pearsoncorrelation,ANOVA,regression
Fornominal/ordinaldatauseÊ
Differenceofproportions,chisquareandrelatedmeasuresofassociation
StatetheHypothesis
NullHypothesis(Ho):
Thereisnodifferencebetween___and___.
AlternativeHypothesis(Ha):
Thereisadifferencebetween__and__.
Note:
Thealternativehypothesiswillindicatewhethera1-tailedora2-tailedtestisutilizedtorejectthenullhypothesis.
Hafor1-tailtested:
The__of__isgreater(orless)thanthe__of__.
SettheRejectionCriteria
Thisdetermineshowdifferenttheparametersand/orstatisticsmustbebeforethenullhypothesiscanberejected.This"regionofrejection"isbasedonalpha(
)--theerrorassociatedwiththeconfidencele