叶菲.docx
《叶菲.docx》由会员分享,可在线阅读,更多相关《叶菲.docx(16页珍藏版)》请在冰豆网上搜索。
叶菲
4BU005AnalyticalSkillsForBusiness
ModuleLeader:
DrYongWang
YeFei
1023300
4BU005-AnalyticalSkillsForBusiness
Questionone
IfX=2
a).Dataused
5
7
4
4
5
5
4
4
8
3
9
9
3
5
7
5
10
6
7
8
5
7
5
8
10
6
6
9
4
3
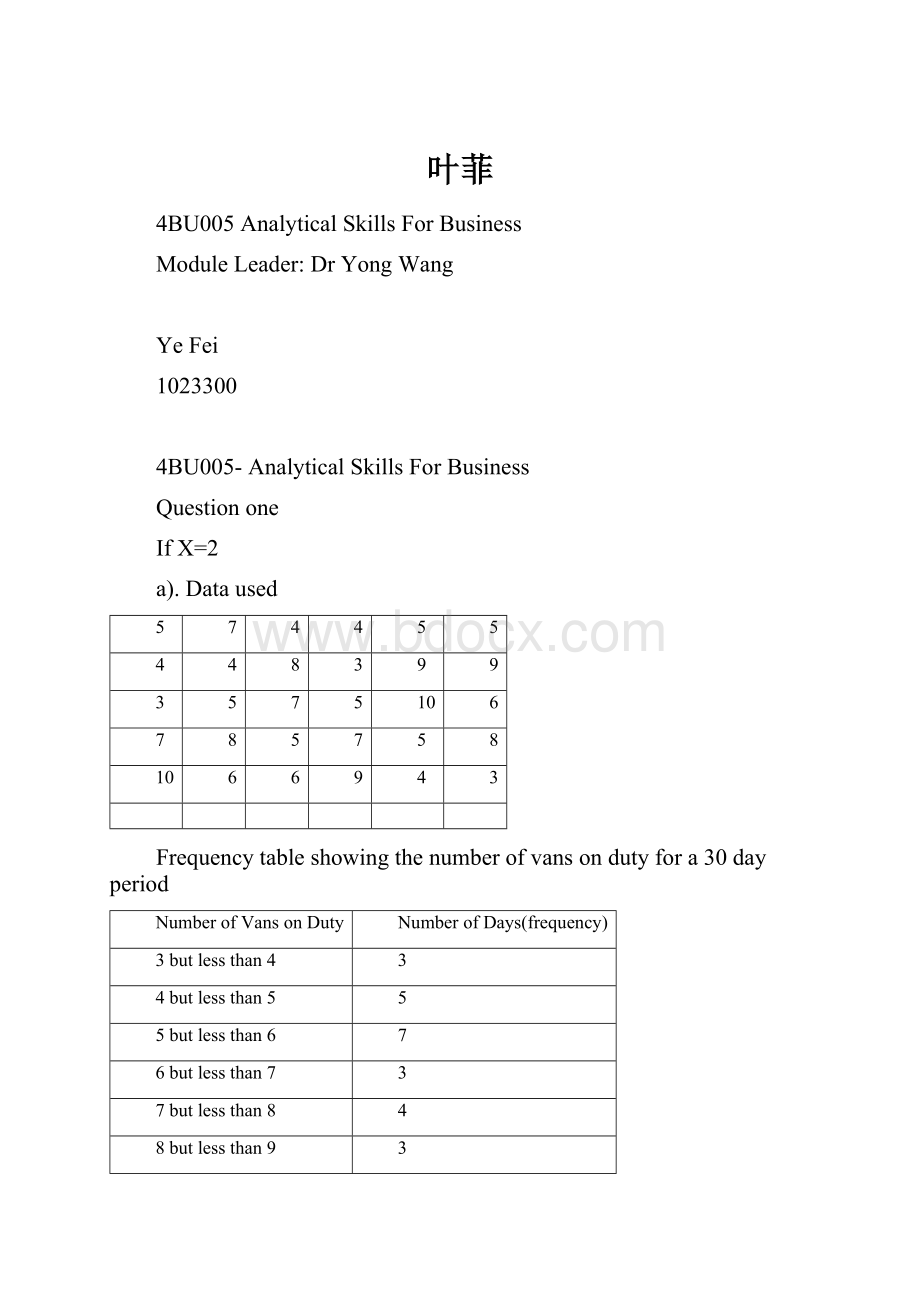
Frequencytableshowingthenumberofvansondutyfora30dayperiod
NumberofVansonDuty
NumberofDays(frequency)
3butlessthan4
3
4butlessthan5
5
5butlessthan6
7
6butlessthan7
3
7butlessthan8
4
8butlessthan9
3
9butlessthan10
3
10butlessthan11
2
total
30
Workingforclassintervals
Range=10-3=7
b).
c).Inthehistogram,wecanseethatthevaluearenotsymmetrical.Themostcommonnumberofvansavailableinthe30dayperiodwas5or6vans.Thehistogramisinclinedtorightside.
Inthefirstthreegroups,thenumberisincreasedallthetime.Thesecondoneis4-5numbersofvansondutyandthefrequencyis8.Ingroup3-4thefrequencyincreasesto3andthen4-5,5-6.5-6thefrequencyincreaseshowingthetopofthenumber.6-7frequencyisbackthenumberof3-4,then,inlastthirdgroupdecreasesshowingthebarsslopingdown.Thelowestfrequencyis2.
Thehighestnumberofthevansis10andthelowestnumberofthevansis3.Thisdateshowsthatthevansarenotequallydistributed,asmorevansareavailableonsomedaysthanothers.Thiscouldbeduetomanydifferentreasonsaffectingthebusinesssuchastheweatherandthetimeofthemonth.
Ifthedataweregroupeddifferentlysuchasusingmoreintervalsthenthehistogramwouldlookdifferent,asthedatawouldbemorespreadout.
Question2
IfX=2
Tableshowingthevalueofthecompany’sassetsoverafive-period.
Values(£’000s)
Asset
2005
2006
2007
2008
2009
Property
70
72
87
92
87
Plant&machinery
170
160
175
180
180
Stock&workinprogress
540
550
590
600
600
Debtors
420
440
520
550
590
cash
30
50
110
80
60
a)
b).
Thelinegraphshowsthevalueofassetsinafiveyearperiodanalyze.
Thestockandworkinprogressisthehighestvaluedassetoftheyearsanalyzed,it’sthehighestin2009anditincreasedto£600,000.Thedebtorsincreaseallthetimeinfiveyears.Thevalueisasthesameasthestock&workinprogressin2009.Boththeplant&machineryandtheproperty’svaluearesymmetry.Theplant&machineryalwaysbetween£100,000and£200,000inthefiveyearsandtheproperty’svalueisalwaysbelow£100,000.Thecashisthelowestvaluedasset.Onlyin2007doesitincreaseto£110,000inthisyear.
Question3
IfX=2
Tableshowingthetimestakenfor30customerstobeservedinthebank.
(minute)
0.46
1.78
2.38
2.39
2.54
2.59
3.28
3.78
4.65
4.87
5.24
5.26
5.33
5.33
5.76
6.27
6.55
6.56
6.72
7.37
7.45
7.66
7.68
8.10
8.29
8.77
9.55
9.66
9.66
10.99
Total=176.92
a.)
Workings:
=176.92/30≈5.90
Median=(n+1)/2=(30+1)/2=15.5orderedobservation
15.5number=(6.27+5.76)/2=13.03/2=6.5minute
Firstquartile=(n+1)/4=31/4=7.75≈8orderedobservation
Rule3Q1=8thnumber=3.78miunte
Thirdquartile=(n+1)*3/4=(30+1)*3/4=93/4=23.25≈23orderedobservation
Rule3Q3=23rdnumber=7.68minute
Answers:
Mean=5.90miunte
Media=6.5miunte
Firstquartile=3.78miunte
Thirdquartile=7.68miunte
b).
Time(middlevalue)x
x-m
(x-m)2
0.46
-5.44
29.59
1.78
-4.12
16.97
2.38
-3.52
12.39
2.39
-3.51
12.32
2.54
-3.36
11.29
2.59
-3.31
10.96
3.28
-2.62
6.86
3.78
-2.12
4.49
4.65
-1.25
1.56
4.87
-1.03
1.06
5.24
-0.66
0.44
5.26
-0.64
0.41
5.33
-0.57
0.32
5.33
-0.57
0.32
5.76
-0.14
0.02
6.27
0.37
0.14
6.55
0.65
0.42
6.56
0.66
0.44
6.72
0.82
0.67
7.37
1.47
2.16
7.45
1.55
2.40
7.66
1.76
3.10
7.68
1.78
3.17
8.10
2.20
4.84
8.29
2.39
5.71
8.77
2.87
8.24
9.55
3.65
13.32
9.66
3.76
14.14
9.66
3.76
14.14
10.99
5.09
25.91
-0.08
(m=5.90)
Workings:
Standarddeviation=
=
=
=2.63minute
Range=10.99-0.46=10.5miunte
Inter-quartilerange=Q3-Q1=7.68-3.78=3.9minute
Answers:
Standarddeviation=2.63minute
Range=10.5miuntes
Inter-quartilerange=3.9minute
c).
Thebranchmanagershouldbebasetheirstatementtotellthecustomerhowlongwillthecustomerneedtowait.Themeantimeis5.9minute,thenthemanagerreplies,”Almostcertainlynotlongerthanfiveminute”iscertainlyincorrect.What’smore,ifthemanagerusedthemediantime,themanagerwouldbeincorrectasthisis6.5minute.
Intheotherway,thebranchmanagerisusingthetimeonthefirstquartiletimeof3.78miuntes,that’sunderfiveminute.Theinter-quartilerangeisalsounderfiveminute.Becausetheinter-quartileisthirdquartileof7.68minutelessfirstquartilesequal3.9minute,asthisisunderfiveminute.Butthisisnotveryaccuracytojudgethetiming.Theinter-quartilerangerepresentsthecentralfiftypercentofthedatathatjustthepartofdata,notincludedallofthedata,so,it’snotsoaccuracy.What’smore,thestandarddeviationis2.63minutethat’slessthanfiveminute.Ifthemanageranalyzefromthestandarddeviation,that’scorrect.However,thestandarddeviationtimeistheaveragebetweeneachindividualvalueandthemeanvalueofdata.Therangeofthedatais10.5minute,therefore,thestandarddeviationshouldn’tbeusedasatimetogivetoacustomer.Boththequartileandstandarddeviationisblemishtoestimatethetiming.
Eventhoughtthereissomewaytoevaluatethewaittimeislessthanfiveminute,allofthemarenotsoaccuracy.Onbasisoftheresultsofa)andb),thecommonreplyismorethanfiveminute,
Question4
a)IfX=2
Tableshowingtheaccesstimeofacomputerdiscsystem:
accesstimeinmillisecond
frequency
cumulativefrequency
middlevalue(x)
fx
x-m
(x-m)2
f(x-m)2
30butlessthan35
39
39
32.5
1268
-11.37
129.28
5041.80
35butlessthan40
56
95
37.5
2100
-6.37
40.58
2272.31
40butlessthan45
31
126
42.5
1318
-1.37
1.88
58.18
45butlessthan50
50
176
47.5
2375
3.63
13.18
658.85
50butlessthan55
21
197
52.5
1103
8.63
74.48
1564.01
55butlessthan60
35
232
57.5
2013
13.63
185.78
6502.19
Total
232
10177
16097.34
Workings
Standarddeviation=
=
=
=8.33milliscecond
Answers
Mean=43.86milliseconds
Standarddeviation=8.33milliseconds
b).
Tableshowingcumulativefrequencypercentagefortheaccesstimeonthecomputersystem:
accesstime(milliseconds)
frequency
cumulativefrequency
Cumulativepercentage(%)
30butlessthan35
39
39
17
35butlessthan40
56
95
41
40butlessthan45
31
126
54
45butlessthan50
50
176
76
50butlessthan55
21
197
85
55butlessthan60
35
232
100
total
232
Media=232/2=116thnumber
Thenumberofthe116isinthegroupof40butlessthan45.Fromthecumulativefrequencychartwecanseethatthemediaisinthegroupof40butlessthan45
c).
Tableshowingaccesstimetothecomputerdiscsystemwhenincreasedby5milliseconds.
accesstimeinmillisencond
frequency
cumulativefrequendy
middlevalue(x)
fx
x-m
(x-m)2
f(x-m)2
35butlessthan40
39
39
37.5
1462.5
-11.36
129.05
5032.93
40butlessthan45
56
95
42.5
2380
-6.36
40.45
2265.18
45butlessthan50
31
126
47.5
1472.5
-1.36
1.85
57.34
50butlessthan55
50
176
52.5
2625
3.64
13.25
662.48
55butlessthan60
21
197
57.5
1207.5
8.64
74.65
1567.64
60butlessthan65
35
232
62.5
2187.5
13.64
186.05
6511.74
Total
232
11335
16097.31
Workings
Standarddeviation=
=
=8.33millisecond
Answers
Mean=48.86millisecond
Standarddeviation=8.33millisecond
d).
accesstimeinmillisecond
frequency
cumulativefrequendy
midpoint(x)
fx
x-m
(x-m)2
f(x-m)2
42butlessthan49
39
39
45.5
1774.5
-15.9
252.81
9859.59
49butlessthan56
56
95
52.5
2940
-8.9
79.21
4435.76
56butlessthan63
31
126
59.5
1844.5
-1.9
3.61
111.91
63butlessthan70
50
176
66.5
3325
5.1
26.01
1300.5
70butlessthan77
21
197
73.5
1543.5
12.1
146.41
3074.61
77butlessthan84
35
232
80.5
2817.5
19.1
364.81
12768.35
Total
232
14245
31550.72
Workings
=11265/232=61.4milliseconds
Standarddeviation=
=
e).
Thestandarddeviationina)andc),bothofthemare8.33millisecond.Becausethefrequencyisnotchange,theaccesstimeshaveallbeenincreasedbyfive.Themeanisthe1.4multipleofstandarddeviation,so,61.4(d)=1.4X43.86(a).11.6(d)=1.4*8.33(a).Thef(x-m)2isalmostthesameinthea)andc).however,thef(x-m)2ismuchbiggerwhentheaccessnumberincrease40%,becausethemeanvaluewillchangealot.
Question5
a).tableshowingthenumberofhousessoldineachpriceinterval.
priceofhousein£,000
frequency
cum.frequency
midpoint(x)
fx
x-m
(x-m)2
f(x-m)2
below150
22
22
75
1650
-99.89
9978.01
219516.27
150nbutunder170
84
106
160
13440
-14.89
221.71
18623.82
170butunder190
54
160
180
9720
5.11
26.11
1410.05
190butunder210
39
199
200
7800
25.11
630.51
24589.97
210butunder230
20
219
220
4400
45.11
2034.91
40698.24
230butunder250
12
231
240
2880
65.11
4239.31
50871.75
250butunder270
6
237
260
1560
85.11
7243.71
43462.27
TOTAL
237
41450
24374.28
399172.37
Workings
=41450/237=174.89
Standarddeviation=
Answers
Mean=174.89(£000’s)
Standarddeviation=41.04(£000’s)
Asurveyofhousepricesinfivelocalnewspapersisveryclear.Thepriceinthe£170,000butunder£190,000soldthebest.Mostofpeoplecan
 升级会员
升级会员 