机械振动加州大学University of CaliforniaChapter5TwoDimensionalPlots.docx
《机械振动加州大学University of CaliforniaChapter5TwoDimensionalPlots.docx》由会员分享,可在线阅读,更多相关《机械振动加州大学University of CaliforniaChapter5TwoDimensionalPlots.docx(20页珍藏版)》请在冰豆网上搜索。
机械振动加州大学UniversityofCaliforniaChapter5TwoDimensionalPlots
Chapter5Two-DimensionalPlots
5.1THEPLOTCOMMAND
∙Tocreatetwo-dimensionalplots
plot(x,y)
-Theargumentsxandyareeachavector(one-dimensionalarray).
-Bothvectorsmusthavethesamenumberofelements.
-WhentheplotcommandisexecutedafigureiscreatedintheFigureWindow.
-Thecurveisconstructedofstraight-linesegmentsthatconnectthepointswhosecoordinatesaredefinedbytheelementofthevectorsxandy.
-Thefigurethatiscreatedhasaxeswithlinearscaleanddefaultrange.
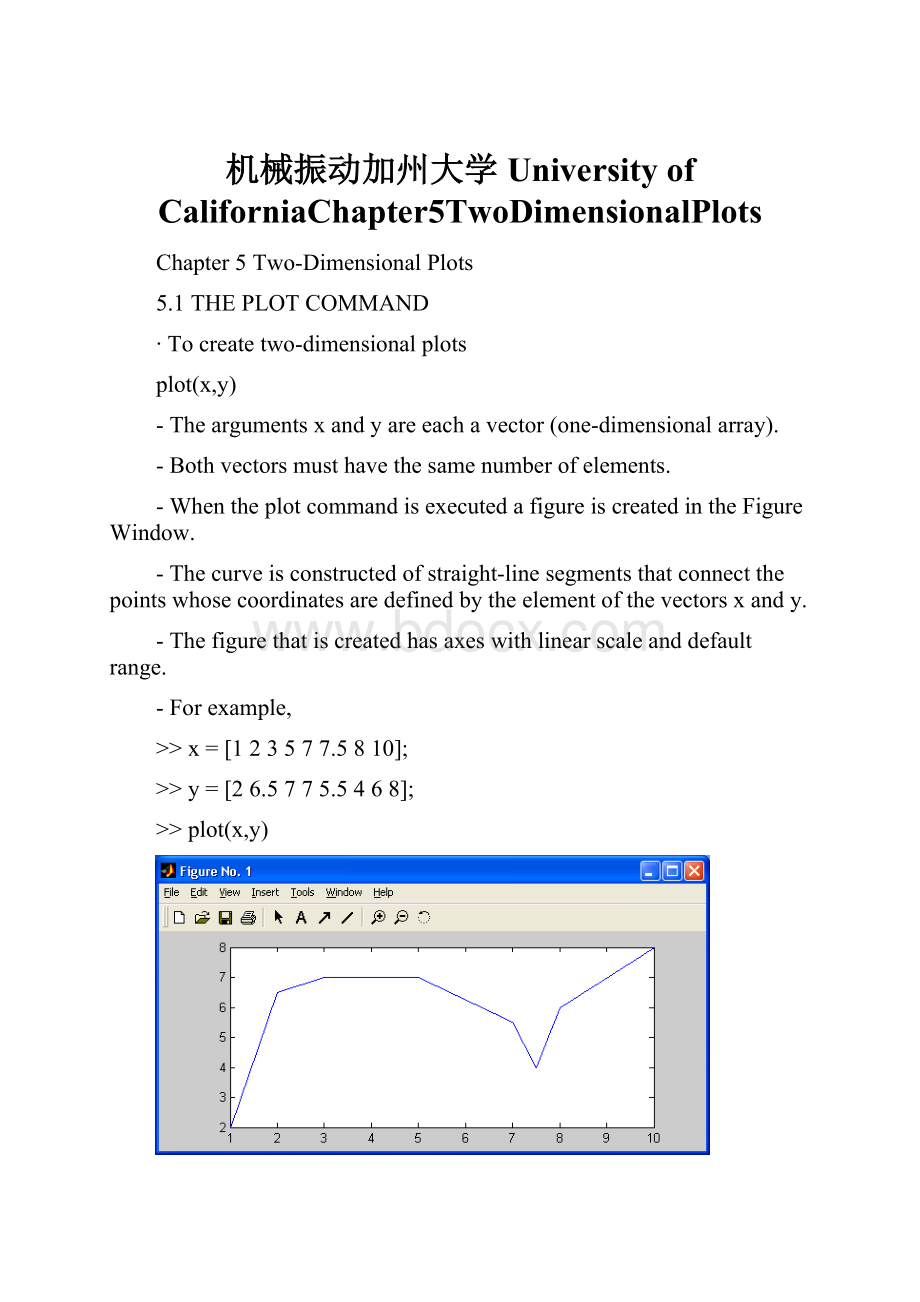
-Forexample,
>>x=[123577.5810];
>>y=[26.5775.5468];
>>plot(x,y)
-Theplotappearsonthescreeninbluewhichisthedefaultlinecolor.
∙Theplotcommandhasadditionaloptionalargumentsthatcanbeusedtospecifythecolorandstyleofthelineandthecolorandtypeofmarkers,ifanyaredesired.Withtheseoptionsthecommandhastheform:
plot(x,y,’linespecifiers’,’PropertyName’,
PropertyValue)
-(Optional)‘linespecifiers’thatdefinesthetypeandcolorofthelineandmarkers.
-(Optional)With’PropertyName’,PropertyValue,propertieswithvaluesthatcanbeusedtospecifythelinewidth,andmarker’ssizeandedge,andfillcolors.
LineSpecifiers:
∙Thelinestylespecifiersare:
LineStyle
Specifier
LineStyle
Specifier
Solid(default)
-
Dotted
:
Dashed
--
Dash-dot
-.
∙Thelinecolorspecifiersare:
LineColor
Specifier
LineColor
Specifier
Red
r
Magenta
m
Green
g
Yellow
y
Blue
b
Black
k
Cyan
c
White
w
∙Themarkertypespecifiersare:
MarkerType
Specifier
MarkerType
Specifier
plussign
+
square
s
circle
o
diamond
d
asterisk
*
five-pointedstar
p
point
.
six-pointedstar
h
Notesaboutusingthespecifiers
∙Thespecifiersaretypedinsidetheplotcommandasstrings.
∙Withinthestringthespecifierscanbetypedinanyorder.
∙Thespecifiersareoptional.Thismeansthatnone,one,two,orallthethreecanbeincludedinacommand.
∙Someexamples:
plot(x,y,’r’)Aredsolidlineconnectsthepoints.
plot(x,y,’--y’)Ayellowdashedlineconnectsthepoints.
plot(x,y,’*’)Thepointsaremarkedwith*(nolinebetweenthepoints).
plot(x,y,’g:
d’)Agreendottedlineconnectsthepointsthataremarkedwithdiamondmarkers.
PropertyNameandPropertyValue:
∙Propertiesareoptionalandcanbeusedtospecifythethicknessoftheline,thesizeofthemarker,andthecolorsofthemarker’sedgelineandfill.
∙ThePropertyNameistypedasastring,followedbyacommandavaluefortheproperty,allinsidetheplotcommand.
∙Fourpropertiesandpossiblevaluesare:
PropertyName
Description
PossiblePropertyValues
LineWidth
(orlinewidth)
Specifiesthewidthoftheline
Anumberinunitsofpoints(default0.5)
MarkerSize
(ormarkersize)
Specifiesthesizeofthemarker
Anumberinunitsofpoints
MarkerEdgeColor
(ormarkeredgecolor)
Specifiesthecolorofthemarker,orthecoloroftheedgelineforfilledmarker.
Colorspecifiers,typedasastring
MarkerFaceColor
(ormarkerfacecolor)
Specifiesthecolorofthefillingforfilledmarker
Colorspecifiers,typedasastring
-Forexample,thecommandscreateaplotthatconnectsthepointswithamagentasolidlineandcirclesasmarkersatthepoints.Thelinewidthistwopointsandthesizeofthecirclemarkersis12points.Themarkershaveagreenedgelineandyellowfilling.
>>x=[123577.5810];
>>y=[26.5775.5468];
>>plot(x,y,'-mo','linewidth',2,'markersize',12,'markeredgecolor','g','markerfacecolor','y')
5.1.1PlotofGivenData
∙Forexample,withthesalesdataofacompanyfrom1988to1994,
>>yr=[1988:
1:
1994];
>>sle=[8122022182427];
>>plot(yr,sle,'--r*','linewidth',2,'markersize',12)
5.1.2PlotofaFunction
∙Toplotagivenfunction,usetheplotorthefplotcommands.
∙Withtheplotcommand,theuserneedstofirstcreateavectorofvaluesofxforthedomainthatthefunctionwillbeplotted.Then,avectoryiscreatedbyusingelement-by-elementcalculations.
∙Toplot
for-2x4,
%Chapter5Plot1.m
%thefunction:
3.5.^(-0.5*x).*cos(6x)
x=[-2:
0.01:
4];
y=3.5.^(-0.5*x).*cos(6*x);
plot(x,y)
>>helpChapter5Plot1
Chapter5Plot1.m
thefunction:
3.5.^(-0.5*x).*cos(6x)
>>Chapter5Plot1
-TheplotcanbecopiedfromtheFigureWindow(intheEditmenuselectCopyFigure)andthenpasteitinotherapplications.
5.2THEfplotCOMMAND
∙Thefplotcommandplotsafunctionwiththeformy=f(x)betweenspecifiedlimits.Thecommandhastheform:
fplot(‘function’,limits,linespecifiers)
‘function’
-Thefunctioncanbetypeddirectlyastringinsidethecommand.Forexample,ifthefunctionis
itistypedas‘8*x^2+5*cos(x)’.
-Thefunctioncannotincludepreviouslydefinedvariables.
limits
-Thelimitsisavectorwithtwoelementsthatspecifythedomainofx[xmin,xmax],oravectorwithfourelementsthatspecifiesthedomainofxandthelimitsofthey-axis[xmin,xmax,ymin,ymax].
∙Forexample,aplotof
for
canbecreatedwiththefplotcommand:
>>fplot('x^2+4*sin(2*x)-1',[-33])
5.3PLOTTINGMULTIPLEGRAPHSINTHESAMEPLOT
5.3.1UsingtheplotCommand
∙Twoormoregraphscanbecreatedinthesameplotbytypingpairsofvectorsinsidetheplotcommand:
plot(x,y,u,v,t,h)
-Itcreatesthreegraphsallinthesameplot.
-Thevectorsofeachpairmustbeofthesamelength.
-MATLABautomaticallyplotsthegraphsindifferentcolors.
-Itispossibletoaddlinespecifiersfollowingeachpair.Forexample,
plot(x,y,’-b’,u,v,’—r’,t,h,’g:
’)
[SampleProblem5-1]Plotthefunction
anditsfirstandsecondderivatives,for-2x4,allinthesameplot.
%SP5_1.m
x=[-2:
0.01:
4];
y=3*x.^3-26*x+10;
dy=9*x.^2-26;
ddy=18*x;
plot(x,y,'-b',x,dy,'--r',x,ddy,':
k')
5.3.2Usingtheholdon,holdoffCommands
%SP5_1_a.mforSampleProblem5-1
x=[-2:
0.01:
4];
y=3*x.^3-26*x+10;
dy=9*x.^2-26;
ddy=18*x;
plot(x,y,'-b')
holdon
plot(x,dy,'--r')
plot(x,ddy,':
k')
5.3.3UsingthelineCommand
∙Withthelinecommandadditionalgraphs(lines)canbeaddedtoaplotthatalreadyexists.Theformofthelinecommandis:
line(x,y,’PropertyName’,propertyValue)
-(Optional)’PropertyName’,propertyValue
-Theformatoflinecommandisalmostthesameastheplotcommand.
-Thelinecommanddoesnothavethelinespecifiers.
∙
Theplotcommandstartsanewploteverytimeitisexecuted,whilethelinecommandaddslinestoaplotthatalreadyexists.Thus,fortheSampleProblem5-1,thefollowingM-filecanbeused:
%SP5_1_b.mforSampleProblem5-1
x=[-2:
0.01:
4];
y=3*x.^3-26*x+10;
dy=9*x.^2-26;
ddy=18*x;
plot(x,y,'-b')
line(x,dy,'linestyle','--','color','r')
line(x,ddy,'linestyle',':
','color','k')
5.4FORMATTINGAPLOT
∙Afigurethatcontainsaplotneedstobeformattedtodisplayinformationinadditiontothegraphitself.Itcanincludespecifyingaxislabels,plottitle,legend,grid,rangeofcustomaxis,andtextlabels.
5.4.1FormattingaplotUsingCommands
Thexlabelandylabelcommands:
∙Labelscanbeplacednexttotheaxeswiththefollowingcommands:
xlabel(‘textasstring’)
ylabel(‘textasstring’)
Thetitlecommand:
∙Thetextisplacedatthetopofthefigureasatitlewiththefollowingcommand:
title(‘textasstring’)
Thetextcommand:
∙Atextcanbeplacedintheplotwiththetextorgtextcommands:
text(x,y,’textasstring’)
gtext(‘textasstring’)
-Thetextcommandplacesthetextinthefiguresuchthatthefirstcharacterispositionedatthepointwiththecoordinatesx,y(accordingtotheaxesofthefigure).
-Thegtextcommandplacesthetextatapositionspecifiedbytheuser.Whenthecommandisexecuted,theFigureWindowopensandtheuserspecifiesthepositionwiththemouse.
Thelegendcommand:
∙Toplacealegendontheplot,
legend(‘string1’,‘string2’,…,pos)
-Thestringsarethelabelsthatareplacednexttothelinesample.
-Theirordercorrespondstotheorderthatthegraphswerecreated.
-Theposisanoptionalnumberthatspecifieswhereinthefigurethelegendisplaced.Theoptionsare:
pos=-1Placesthelegendoutsidetheaxesboundariesontherightside.
pos=0Placesthelegendinsidetheaxesboundariesinalocationthatinterferestheleastwiththegraphs.
pos=1Placesthelegendattheupper-rightcorneroftheplot(default).
pos=2Placesthelegendattheupper-leftcorneroftheplot.
pos=3Placesthelegendatthelower-leftcorneroftheplot.
pos=4Placesthelegendatthelower-rightcorneroftheplot.
Formattingthetext:
∙AcompleteexplanationofalltheformattingfeaturescanbefoundintheHelpWindowunderTextandTextProperties.
∙Theformattingcanbedoneeitherbyaddingmodifiersinsidethestring,orbyaddingtothecommandoptionalPropertyNameandPropertyValueargumentsfollowingthestring.
∙Themodifiersarecharactersthatareinsertedwithinthestring.
Modifier
Effect
\bf
boldfont
\it
italicstyle
\rm
normalfont
\fontname{fontname}
specifiesfontisused
\fontsize{fontsize}
specifiesfontsizeisused
-Thesemodifiersaffectthetextfromthepointthattheyareinserteduntiltheendofthestring.
-Itispossibletohavethemodifiersappliedtoonlyasectionofthestringbytypingthemodifierandthetexttobeaffectedinsidebraces{}.
∙Thesubscriptandsuperscript:
-Asinglecharactercanbedisplayedasasubscriptorasuperscriptbytyping_or^infrontofthecharacter,respectively.
-Severalconsecutivecharacterscanbedisplayedassubscriptorasuperscriptbytypingthecharactersinsidebraces{}followingthe_orthe^.
∙
 升级会员
升级会员 