中南大学信号与系统实验报告.docx
《中南大学信号与系统实验报告.docx》由会员分享,可在线阅读,更多相关《中南大学信号与系统实验报告.docx(18页珍藏版)》请在冰豆网上搜索。

中南大学信号与系统实验报告
《信号与系统》
实验报告
目录
实验一基本信号的生成1
实验二信号的基本运算7
实验三系统的时域分析12
实验四周期信号的频域分析20
实验一
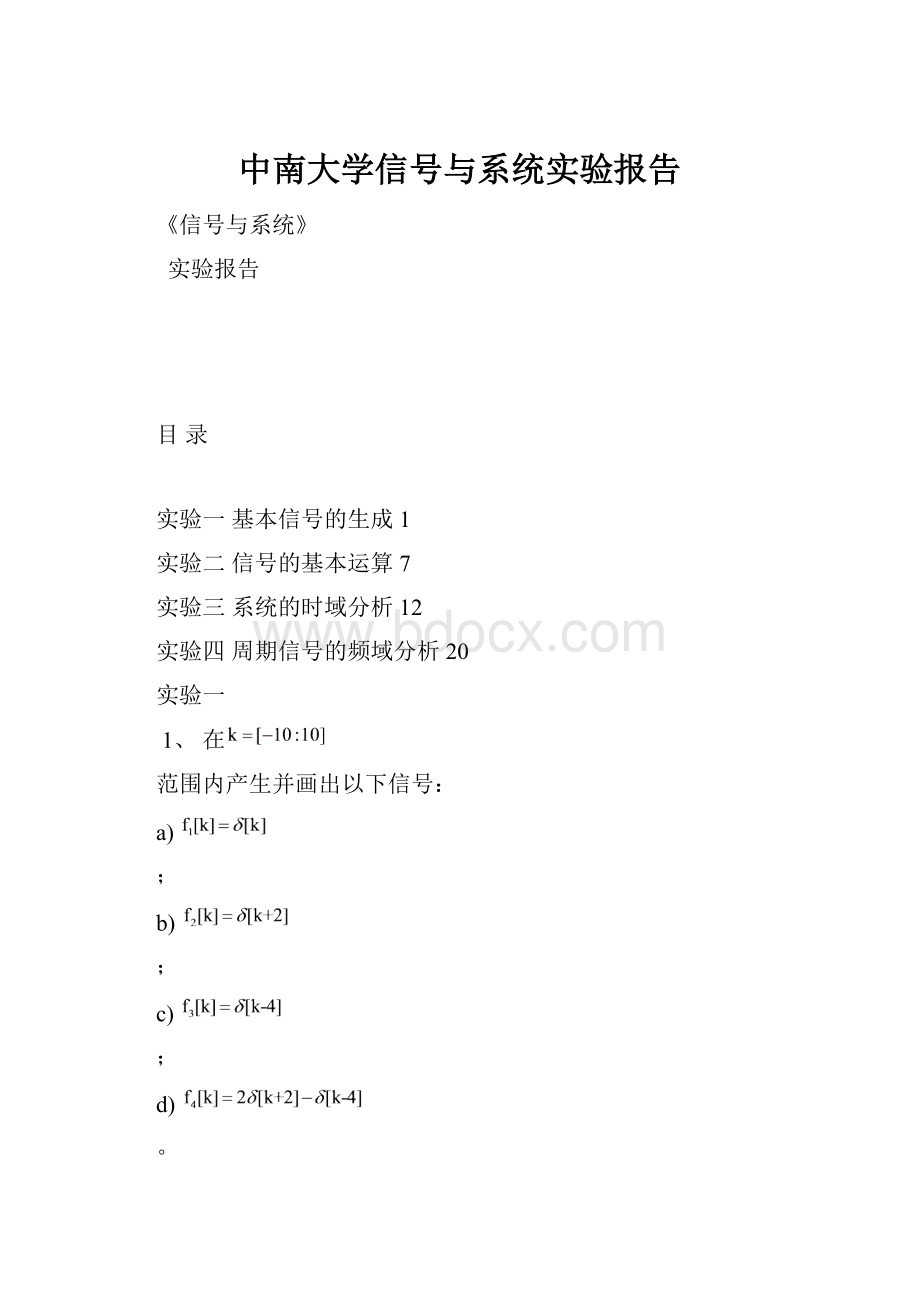
1、在
范围内产生并画出以下信号:
a)
;
b)
;
c)
;
d)
。
2、在
范围内产生并画出以下信号:
a)
;
b)
;
c)
。
请问这三个信号的基波周期分别是多少?
1、a)k1=-10:
10;
delta=[zeros(1,10),1,zeros(1,10)];
stem(k1,delta)
b)
k=-10:
10;
delta=[zeros(1,8),1,zeros(1,12)];
stem(k,delta)
C)
k=-10:
10;
delta=[zeros(1,14),1,zeros(1,6)];
stem(k,delta)
D)
k=-10:
10;
delta1=[zeros(1,8),1,zeros(1,12)];
delta2=[zeros(1,14),1,zeros(1,6)];
y1=2*delta1;
y2=delta2;
stem(k,y1-y2)
2、a)
k=0:
31;
f1=sin(k*pi/4).*cos(k*pi/4);
stem(k,f1)
2(b)
k=0:
31;
f2=(cos(k*pi/4)).^2;
stem(k,f2)
2(c)
k=0:
30;
f3=sin(k*pi/4).*cos(k*pi/8);
stem(k,f3)
实验二
已知信号
如下图所示:
a)用MATLAB编程复现上图;
b)画出
的波形;
c)画出
的波形;
d)画出
的波形。
已知信号
如下图所示:
t=-4:
0.001:
4;
ft1=2*tripuls(t,6,0);
subplot(2,2,1)
plot(t,ft1)
title('f(t)')
ft2=2*tripuls(2-2*t,6,0);
subplot(2,2,2)
plot(t,ft2)
title('f(2-2t)')
h=0.001;
ft3=diff(functri(t))*1/h;
subplot(2,2,3)
plot(t(1:
length(t)-1),ft3)
title('df(t)/dt')
forx=1:
length(t)
ft4(x)=quad('functri',-4,t(x));
end
subplot(2,2,4)
plot(t,ft4)
title('integraloff(t)')
实验三
1、
k=-20:
100;
a=[1-10.9];
b=[1];
h=impz(b,a,k);
subplot(211)
stem(k,h)
title('单位脉冲响应的近似值')
K=-10:
50;
hk=0.9.^k;
subplot(212)
stem(k,hk)
axis([010-20003000])
title('单位脉冲响应的理论值')
k=-10:
50;
>>h=0.9.^k;
f=[zeros(1,10),ones(1,11)];
>>z=conv(f,h);
N=length(z);
stem(0:
N-1,z)
R=101;
>>d=rand(1,R)-0.5;
>>t=0:
100;
>>s=2*sin(0.05*pi*t);
>>f=s+d;
>>subplot(211);
>>plot(t,d,'g-.',t,s,'b--',t,f,'r-');
>>legend('d[t]','s[t]','f[t]');
>>b=[0.220];a=[1-0.8];
>>y=filter(b,a,f);
>>subplot(212);
>>plot(t,s,'b--',t,y,'r-');
>>legend('s[t]','y[t]')
实验四
1、function[A_sym,B_sym]=CTFShchsym
symstnkx
T=4;
tao=T/4;
a=-1.5;
ifnargin<4
Nf=10;
end
ifnargin<5
Nn=32;
end
x=time_fun_x(t);
A0=int(x,t,a,T+a)/T;
As=2/T*int(x*cos(2*pi*n*t/T),t,a,T+a);
Bs=2/T*int(x*sin(2*pi*n*t/T),t,a,T+a);
A_sym
(1)=double(vpa(A0,Nn));
fork=1:
Nf
A_sym(k+1)=double(vpa(subs(As,n,k),Nn));
B_sym(k+1)=double(vpa(subs(Bs,n,k),Nn));
end
ifnargout==0
c=A_sym;
disp(c);
d=B_sym;
disp(d);
t=-3*T:
0.01:
3*T;
f0=c
(1);
f1=c
(2).*cos(2*pi*1*t/T)+d
(2).*sin(2*pi*1*t/T);
f2=c(3).*cos(2*pi*2*t/T)+d(3).*sin(2*pi*2*t/T);
f3=c(4).*cos(2*pi*3*t/T)+d(4).*sin(2*pi*3*t/T);
f4=c(5).*cos(2*pi*4*t/T)+d(5).*sin(2*pi*4*t/T);
f5=c(6).*cos(2*pi*5*t/T)+d(6).*sin(2*pi*5*t/T);
f6=c(7).*cos(2*pi*6*t/T)+d(7).*sin(2*pi*6*t/T);
f7=c(8).*cos(2*pi*7*t/T)+d(8).*sin(2*pi*7*t/T);
f8=c(9).*cos(2*pi*8*t/T)+d(9).*sin(2*pi*8*t/T);
f9=c(10).*cos(2*pi*9*t/T)+d(10).*sin(2*pi*9*t/T);
f10=c(11).*cos(2*pi*10*t/T)+d(11).*sin(2*pi*10*t/T);
f11=f0+f1+f2;
f12=f11+f3;
f13=f12+f4+f5+f6;
f14=f13+f7+f8+f9+f10;
subplot(2,2,1)
plot(t,f0+f1),holdon
y=time_fun_e(t);
plot(t,y,'r:
')
title('直流+基波')
axis([-8,8,-0.5,1.5])
subplot(2,2,2)
plot(t,f12),holdon
y=time_fun_e(t);
plot(t,y,'r:
')
title('1-3次谐波+直流')
axis([-8,8,-0.5,1.5])
subplot(2,2,3)
plot(t,f13),holdon
y=time_fun_e(t);
plot(t,y,'r:
')
title('1-6次谐波+直流')
axis([-8,8,-0.5,1.5])
subplot(2,2,4)
plot(t,f14),holdon
y=time_fun_e(t);
plot(t,y,'r:
')
title('1-10次谐波+直流')
axis([-8,8,-0.5,1.5])
holdoff
end
functiony=time_fun_e(t)
a=1.5;
T=4;
h=1;
tao=T/4;
t=-3*T:
0.01:
3*T;
e1=1/2+1/2.*sign(t-0.5+tao/2);
e2=1/2+1/2.*sign(t-0.5-tao/2);
y=h.*(e1-e2);
functionx=time_fun_x(t)
h=1;
x1=sym('Heaviside(t)')*h;
x=x1-sym('Heaviside(t-1)')*h;
2、
function[A_sym,B_sym]=CTFSshbpsym(T,Nf)
symstny
ifnargin<3
Nf=input('pleaseInput所需展开的最高谐波次数:
Nf=');
end
T=input('pleaseInput信号的周期T=');
ifnargin<5
Nn=32;
end
y=time_fun_s(t);
A0=2/T*int(y,t,0,T/2);
As=2/T*int(y*cos(2*pi*n*t/T),t,0,T/2);
Bs=2/T*int(y*sin(2*pi*n*t/T),t,0,T/2);
A_sym
(1)=double(vpa(A0,Nn));
fork=1:
Nf
A_sym(k+1)=double(vpa(subs(As,n,k),Nn));
B_sym(k+1)=double(vpa(subs(Bs,n,k),Nn));
end
ifnargout==0
An=fliplr(A_sym);
An(1,k+1)=A_sym
(1);
An=fliplr(An);
Bn=fliplr(B_sym);
Bn(1,k+1)=0;
Bn=fliplr(Bn);
FnR=An/2-i*Bn/2;
FnL=fliplr(FnR);
N=Nf*2*pi/T;
k2=-N:
2*pi/T:
N;
Fn=[FnL,FnR(2:
end)];
subplot(3,3,3)
x=time_fun_e(t);
subplot(2,1,1)
stem(k2,abs(Fn));
title('连续时间函数周期三角波脉冲的双边幅度谱')
axis([-80,80,0,0.12])
line([-80,80],[0,0],'color','r')
line([0,0],[0,0.12],'color','r')
end
functionx=time_fun_e(t)
T=5;
t=-2*T:
0.01:
2*T;
tao=T/5;
x=rectpuls(t,tao);
subplot(2,2,2)
plot(t,x)
holdon
x=rectpuls(t-5,tao);
plot(t,x)
holdon
x=rectpuls(t+5,tao);
plot(t,x)
title('周期为T=5,脉宽tao=1的矩形脉冲')
axis([-10,10,0,1.2])
functiony=time_fun_s(t)
symst
y=1-abs(t);
x1=sym('Heaviside(t+2)');
x=x1-sym('Heaviside(t-2)');
y=y*x;
ezplot(t,y,[-10,10])
grid