R语言代码试题答案步骤.docx
《R语言代码试题答案步骤.docx》由会员分享,可在线阅读,更多相关《R语言代码试题答案步骤.docx(20页珍藏版)》请在冰豆网上搜索。

R语言代码试题答案步骤
Rversion(2017-11-30)--"Kite-EatingTree"
Copyright(C)2017TheRFoundationforStatisticalComputing
Platform:
x86_64-w64-mingw32/x64(64-bit)
R是自由软件,不带任何担保。
在某些条件下你可以将其自由散布。
用'license()'或'licence()'来看散布的详细条件。
R是个合作计划,有许多人为之做出了贡献.
!
用'contributors()'来看合作者的详细情况
用'citation()'会告诉你如何在出版物中正确地引用R或R程序包。
用'demo()'来看一些示范程序,用'help()'来阅读在线帮助文件,或
用'()'通过HTML浏览器来看帮助文件。
用'q()'退出R.
[原来保存的工作空间已还原]
>h=("",header=true)
.
Errorin(file=file,header=header,sep=sep,quote=quote,:
找不到对象'true'
>h=("",header=TRUE)
>h
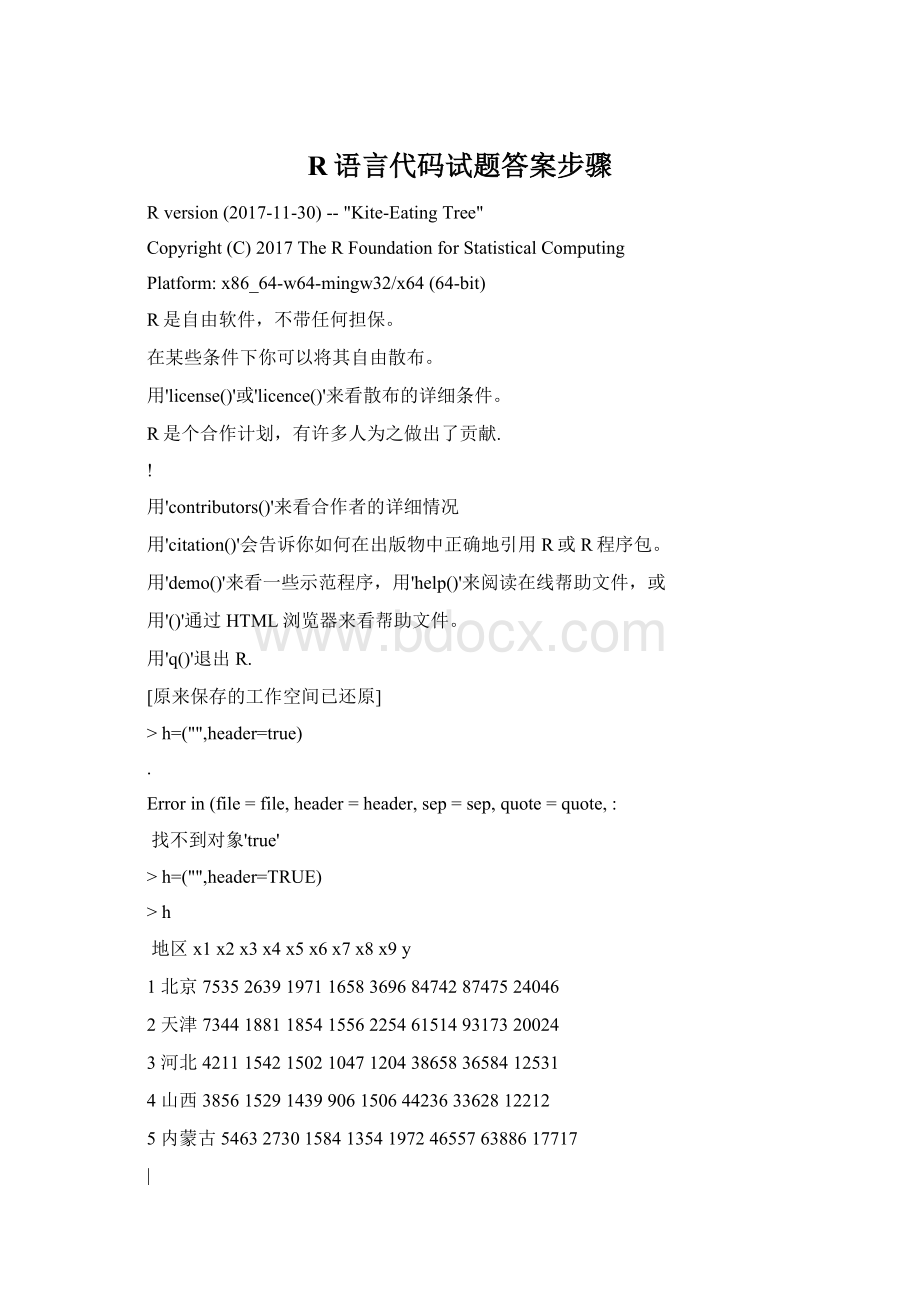
地区x1x2x3x4x5x6x7x8x9y
1北京75352639197116583696847428747524046
2天津73441881185415562254615149317320024
3河北42111542150210471204386583658412531
4山西3856152914399061506442363362812212
5内蒙古54632730158413541972465576388617717
|
6辽宁58092042143313101844418585664916594
7吉林46352045159414481643384074341514614
8黑龙江46871807133711811217364063571112984
9上海96562111179010173724786738537326253
10江苏66581916143710583078506396834718825
11浙江75522110155212282997501976337421545
12安徽58151541139711431933446012879215012
13福建7317163417547732105445255276318593
14江西5072147711746711487385122880012776
15山东52012197157210051656419045176815778
-
16河南46071886119110851525373383149913733
17湖北58381783137110301652398463857214496
18湖南5442162513029181738389713348014609
19广东82581521210010482954502785409522396
20广西5553114613778841626363862795214244
21海南655686515219931320394853237714457
22重庆68702229117711021471444983891416573
23四川6074165112847731587423392960815050
24贵州4993139910146551396411561971012586
25云南546817609749391434376292219513884
!
26西藏55181362845467550517052293611184
27陕西55511789132212122079430733856415333
28甘肃46021631128810501388376792197812847
29青海4667151212329061097464833318112346
30宁夏47691876119310631516474363639414067
31新疆52392031116710281281445763379613892
>lm=lm(y~x1+x2+x3+x4+x5+x6+x7+x8+x9,data=h)
>lm
Call:
:
lm(formula=y~x1+x2+x3+x4+x5+x6+x7+x8+x9,
data=h)
Coefficients:
(Intercept)x1x2x3x4x5x6x7x8x9
>summary(lm)
Call:
。
lm(formula=y~x1+x2+x3+x4+x5+x6+x7+x8+x9,
data=h)
Residuals:
Min1QMedian3QMax
Coefficients:
EstimateStd.ErrortvaluePr(>|t|)
(Intercept)+02+03
@
x1+00***
x2+00***
x3+00***
x4
x5+00***
x6
x7
x8+01+01
x9+01+02
---
。
Signif.codes:
0‘***’‘**’‘*’‘.’‘’1
Residualstandarderror:
on21degreesoffreedom
MultipleR-squared:
AdjustedR-squared:
F-statistic:
on9and21DF,p-value:
<
>pre=(lm)
>res=residuals(lm)
>sd(res)
[1]
。
>res=residuals(lm)
>dy=step(lm)
Start:
AIC=
y~x1+x2+x3+x4+x5+x6+x7+x8+x9
DfSumofSqRSSAIC
-x41213184326
-x91171493201454
-x71177003202005
;
-x81542953238599
-x61895863273891
3184305
-x3126625935846898
-x2145610567745361
-x519377500
-x11
Step:
AIC=
y~x1+x2+x3+x5+x6+x7+x8+x9
{
DfSumofSqRSSAIC
-x91174283201754
-x71185633202889
-x81544373238763
-x61918133276139
3184326
-x3129361306120456
-x2154679418652267
-x519393345
|
-x11
Step:
AIC=
y~x1+x2+x3+x5+x6+x7+x8
DfSumofSqRSSAIC
-x71346343236387
-x61748003276554
-x81821503283904
3201754
$
-x3130553536257107
-x2157258368927590
-x519382624
-x11
Step:
AIC=
y~x1+x2+x3+x5+x6+x8
DfSumofSqRSSAIC
-x81708133307201
《
-x611527773389165
3236387
-x3155012848737672
-x218895049
-x519458098
-x11
Step:
AIC=
y~x1+x2+x3+x5+x6
…
DfSumofSqRSSAIC
-x611375403444741
3307201
-x3157710639078264
-x218871193
-x519473521
-x11
Step:
AIC=
y~x1+x2+x3+x5
}
DfSumofSqRSSAIC
3444741
-x3157178839162624
-x21
-x51
-x11
>summary(dy)
Call:
:
lm(formula=y~x1+x2+x3+x5,data=h)
Residuals:
Min1QMedian3QMax
Coefficients:
EstimateStd.ErrortvaluePr(>|t|)
(Intercept)**
x1***
)
x2***
x3***
x5***
---
Signif.codes:
0‘***’‘**’‘*’‘.’‘’1
Residualstandarderror:
364on26degreesoffreedom
MultipleR-squared:
AdjustedR-squared:
F-statistic:
on4and26DF,p-value:
<
—
>newdata=(x1=5200,x2=2000,x3=1100,x4=1000,x5=1300,x6=45000,x7=34000,x8=,x9=
>predict(dy,newdata,interval="confidence")
fitlwrupr
1
>
…
\
`
>h=ts("",header=TRUE))
>h
TimeSeries:
Start=1
.
End=56
Frequency=1
X78
[1,]-58
[2,]53
[3,]-63
[4,]13
[5,]-6
[6,]-16
[7,]-14
;
[8,]3
[9,]-74
[10,]89
[11,]-48
[12,]-14
[13,]32
[14,]56
[15,]-86
[16,]-66
[17,]50
:
[18,]26
[19,]59
[20,]-47
[21,]-83
[22,]2
[23,]-1
[24,]124
[25,]-106
[26,]113
[27,]-76
&
[28,]-47
[29,]-32
[30,]39
[31,]-30
[32,]6
[33,]-73
[34,]18
[35,]2
[36,]-24
[37,]23
<
[38,]-38
[39,]91
[40,]-56
[41,]-58
[42,]1
[43,]14
[44,]-4
[45,]77
[46,]-127
[47,]97
;
[48,]10
[49,]-28
[50,]-17
[51,]23
[52,]-2
[53,]48
[54,]-131
[55,]65
[56,]-17
>plot(h,type="o")
:
>local({pkg<-(sort(.packages=TRUE)),graphics=TRUE)
+if(nchar(pkg))library(pkg,=TRUE)})
Warningmessage:
程辑包‘urca’是用R版本来建造的
>adf=(h),type=c("drift"),selectlags=c("AIC"))
>summary(adf)
###############################################
)
#AugmentedDickey-FullerTestUnitRootTest#
###############################################
Testregressiondrift
Call:
lm(formula=~+1+Min1QMedian3QMax
>
Coefficients:
EstimateStd.ErrortvaluePr(>|t|)
(Intercept)
***
---
Signif.codes:
0‘***’‘**’‘*’‘.’‘’1
Residualstandarderror:
on51degreesoffreedom
MultipleR-squared:
AdjustedR-squared:
[
F-statistic:
on2and51DF,p-value:
<
Valueoftest-statisticis:
Criticalvaluesforteststatistics:
1pct5pct10pct
tau2
phi1
)
>acf(h)
>pacf(h)
>ar=sarima(h,1,0,4,details=F)
>ar
$fit
Call:
《
stats:
:
arima(x=xdata,order=c(p,d,q),seasonal=list(order=c(P,D,
Q),period=S),xreg=xmean,=FALSE,=list(trace=trc,
REPORT=1,reltol=tol))
Coefficients:
ar1ma1ma2ma3ma4xmean
.
sigma^2estimatedas1850:
loglikelihood=,aic=
、
$degrees_of_freedom
[1]50
$ttable
EstimateSE
ar1
ma1
ma2
ma3
'
ma4
xmean
$AIC
[1]
$AICc
[1]
$BIC
@
[1]
>ma=sarima(h,0,1,1,details=F)
>ma
$fit
Call:
stats:
:
arima(x=xdata,order=c(p,d,q),seasonal=list(order=c(P,D,
Q),period=S),xreg=constant,=list(trace=trc,REPORT=1,
reltol=tol))
>
Coefficients:
ma1constant
.
sigma^2estimatedas3412:
loglikelihood=,aic=
$degrees_of_freedom
[1]53
、
$ttable
EstimateSE
ma1
constant
$AIC
[1]
$AICc
>
[1]
$BIC
[1]
>arma=sarima(h,1,1,1,details=F)
>arma
$fit
Call:
stats:
:
arima(x=xdata,order=c(p,d,q),seasonal=list(order=c(P,D,
"
Q),period=S),xreg=constant,=list(trace=trc,REPORT=1,
reltol=tol))
Coefficients:
ar1ma1constant
.
sigma^2estimatedas2548:
loglikelihood=,aic=
》
$degrees_of_freedom
[1]52
$ttable
EstimateSE
ar1
ma1
constant
$AIC
|
[1]
$AICc
[1]
$BIC
[1]
>res=residuals(ar$fit)
>(res)
Box-Piercetest
data:
res
X-squared=,df=1,p-value=
>plot(res*res)
>res<-residuals(ma$fit)
>res
TimeSeries:
Start=1
End=56
Frequency=1
[1]+01+01+01+00+00+00+01+01+02+01+00+01+01+01+01
[17]+01+01+01+01+01+00+00+02+02+02+01+01+01+01+01+01
[33]+01+01+00+01+01+01+01+01+01+00+01+01+02+02+01
[49]+01+01+01+01+02+01+01
>(res)#
Box-Piercetest
data:
res
X-squared=,df=1,p-value=
>yc=(h,10,1,1,1)
>yc$pred
TimeSeries:
Start=57
End=66
Frequency=1
[1]