实验2数据可视化处理实验.docx
《实验2数据可视化处理实验.docx》由会员分享,可在线阅读,更多相关《实验2数据可视化处理实验.docx(15页珍藏版)》请在冰豆网上搜索。

实验2数据可视化处理实验
实验2-数据可视化处理实验
科学计算与数据处理实验报告
学 号
姓名
实验名称
数据可视化处理实验
实验目的
1、掌握MATLAB中二维曲线图、三维曲线图、三维曲面图的绘制方法
2、掌握MATLAB中常用统计图的绘制方法
3、熟悉MATLAB中三维图形常用编辑方法
4、了解MATLAB中动画的绘制方法
实验方案
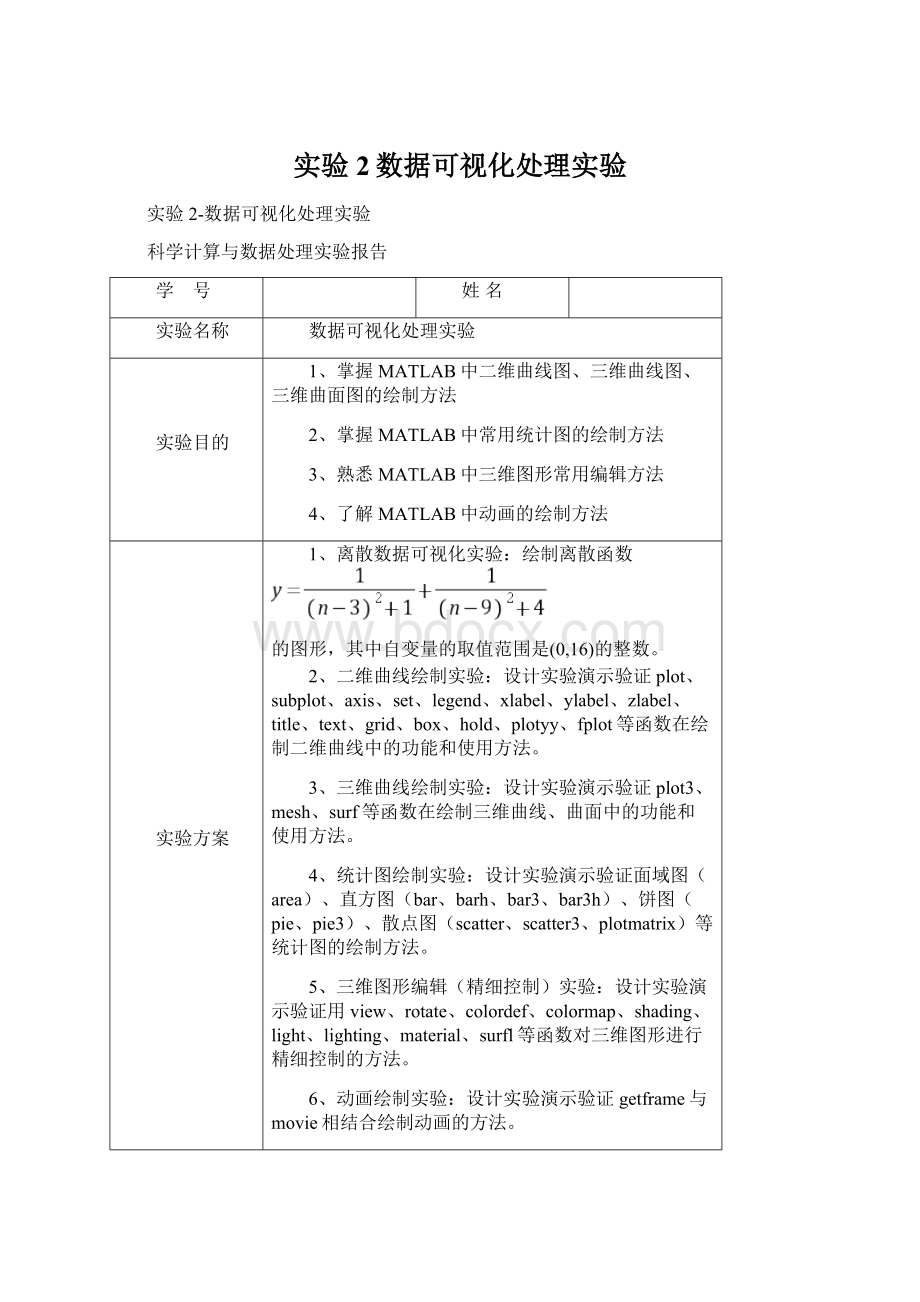
1、离散数据可视化实验:
绘制离散函数
的图形,其中自变量的取值范围是(0,16)的整数。
2、二维曲线绘制实验:
设计实验演示验证plot、subplot、axis、set、legend、xlabel、ylabel、zlabel、title、text、grid、box、hold、plotyy、fplot等函数在绘制二维曲线中的功能和使用方法。
3、三维曲线绘制实验:
设计实验演示验证plot3、mesh、surf等函数在绘制三维曲线、曲面中的功能和使用方法。
4、统计图绘制实验:
设计实验演示验证面域图(area)、直方图(bar、barh、bar3、bar3h)、饼图(pie、pie3)、散点图(scatter、scatter3、plotmatrix)等统计图的绘制方法。
5、三维图形编辑(精细控制)实验:
设计实验演示验证用view、rotate、colordef、colormap、shading、light、lighting、material、surfl等函数对三维图形进行精细控制的方法。
6、动画绘制实验:
设计实验演示验证getframe与movie相结合绘制动画的方法。
实验记录
(1)绘制离散函数
的图形
>>n=1:
0.5:
16;
>>y=1./((n-3).^2+1)+1./((n-9).^2+4)
y=
Columns1through9
0.21470.32430.51890.82161.02500.82920.53450.34890.2500
Columns10through18
0.19950.17690.17300.18380.20710.23850.26730.27700.2584
Columns19through27
0.22000.17750.14040.11120.08910.07250.05990.05020.0427
Columns28through31
0.03670.03190.02800.0248
>>plot(n,y,'*')
(2)plot、subplot、axis、set、legend、xlabel、ylabel、zlabel、title、text、grid、box、hold、plotyy、fplot函数演示
>>x=0:
0.1:
5;
>>y=sin(x);
>>z=cos(x);
>>h=tan(x);
>>subplot(2,1,1);
>>plot(x,y);
>>subplot(2,1,2);
>>plot(x,z);
>>axis([04020]);
>>h=plot(x,y);
>>set(h,'color','b');
>>set(gca,'XGrid','on','YGrid','off');
>>set(gca,'color','g');
>>clear
>>x=0:
0.05:
10;
>>plot(x,sin(x),'*b',x,cos(x),'+r',x,tan(x)./100,'+');
>>legend('sin','cos','tan');
>>clear
>>x=0:
0.05:
15;
>>plot3(x,sin(x),cos(x),'b','linewidth',1);
>>xlabel('X');
>>ylabel('Y');
>>zlabel('Z');
>>title('三维曲线')
>>text(1,1,'图像示例')
>>grid('on')
>>boxon
>>holdon
>>plot3(x,x.^2,x.^(1./2))
>>plot3(x,sin(x),cos(x),'b','linewidth',5);
>>clear
>>x=0:
0.01:
20;
>>y1=200*exp(-0.05*x).*sin(x);
>>y2=0.8*exp(-0.5*x).*sin(10*x);
>>[AX,H1,H2]=plotyy(x,y1,x,y2,'plot');
(3)实验演示plot3、mesh、surf函数
Plot3函数已在上面演示。
>>clear
>>z=peaks(25);
>>subplot(1,2,1);
>>mesh(z)
>>title('mesh函数');
>>subplot(1,2,2);
>>surf(z)
>>title('surf函数');
(4)实验演示面域图(area)、直方图(bar、barh、bar3、bar3h)、饼图(pie、pie3)、散点图(scatter、scatter3、plotmatrix)
>>x=magic(6);
>>area(x);
>>clear
>>x=0:
0.2:
2*pi;
>>y=sin(x);
>>subplot(2,2,1);
>>bar(y);
>>title('bar');
>>subplot(2,2,2);
>>barh(y);
>>title('barh');
>>Y=[1,2,3;4,5,6];
>>subplot(2,2,3);
>>bar3(Y);
>>title('bar3');
>>subplot(2,2,4);
>>bar3h(Y);
>>title('bar3h');
>>x=[1234567];
>>y=[0001000];
>>subplot(1,2,1);
>>pie(x,y);
>>subplot(1,2,2);
>>pie3([43689]);
>>clear
>>a=rand(200,1);
>>b=rand(200,1);
>>c=rand(200,1);
>>scatter(a,b,100,c,'p')
>>clear
>>x=[1:
10];
>>y=x+rand(size(x));
>>z=rand(size(x))+rand(size(y));
>>scatter3(x,y,z,'filled');
>>clear
>>x=randn(100,2);
>>plotmatrix(x)
(5)实验演示用view、rotate、colordef、colormap、shading、light、lighting、material、surfl等函数对三维图形进行精细控制的方法
>>clear
>>z=peaks(25);
>>colordefblack;
>>colormaphot;
>>shadinginterp;
>>surfl(z)
>>clear
>>z=peaks(25);
>>subplot(1,2,1);surf(z);title('Default');
>>subplot(1,2,2);h=surf(z);title('Rotated');
>>rotate(h,[-2,-2,0],30,[2,2,0]);
>>clear
>>z=peaks(25);
>>subplot(1,2,1);surf(z);title('Default');
>>subplot(1,2,2);
>>subplot(1,2,2);h=surf(z);title('view');
>>view(0,45);
(6)实验演示getframe与movie相结合绘制动画
>>[x,y,z]=peaks(25);
>>surf(x,y,z);
>>m=moviein(10);
>>fori=1:
10;
view(24*(i-1),30);
m(:
i)=getframe;
end
>>movie(m,2);
实验总结
通过本次实验,我对Matlab作图有了更深刻的认识,感受到了它强大的作图功能。
本次实验我学会了二维作图和三维作图,并掌握了用legend、xlabel、ylabel、zlabel、title等函数对图像标注,用colordef、colormap、shading等函数对图像进行着色等更精细的控制,最后用getframe与movie相结合绘制动画技术。
本次实验获益匪浅,但这只是Matlab一些浅显的功能,我将继续更进一步的探索学习。