会计专业英语教程Financial Statements Analysis.docx
《会计专业英语教程Financial Statements Analysis.docx》由会员分享,可在线阅读,更多相关《会计专业英语教程Financial Statements Analysis.docx(21页珍藏版)》请在冰豆网上搜索。
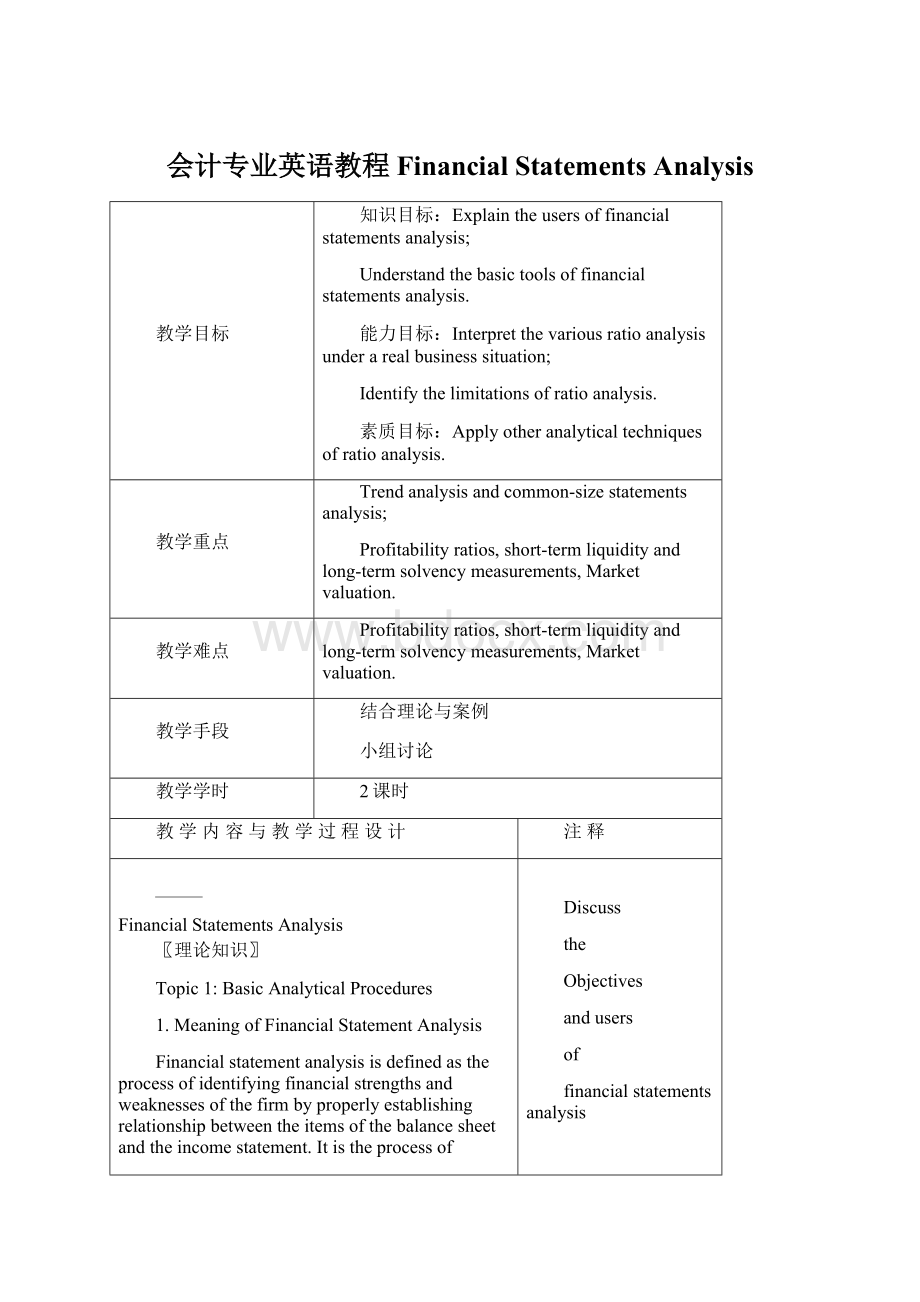
会计专业英语教程FinancialStatementsAnalysis
教学目标
知识目标:
Explaintheusersoffinancialstatementsanalysis;
Understandthebasictoolsoffinancialstatementsanalysis.
能力目标:
Interpretthevariousratioanalysisunderarealbusinesssituation;
Identifythelimitationsofratioanalysis.
素质目标:
Applyotheranalyticaltechniquesofratioanalysis.
教学重点
Trendanalysisandcommon-sizestatementsanalysis;
Profitabilityratios,short-termliquidityandlong-termsolvencymeasurements,Marketvaluation.
教学难点
Profitabilityratios,short-termliquidityandlong-termsolvencymeasurements,Marketvaluation.
教学手段
结合理论与案例
小组讨论
教学学时
2课时
教学内容与教学过程设计
注释
FinancialStatementsAnalysis
〖理论知识〗
Topic1:
BasicAnalyticalProcedures
1.MeaningofFinancialStatementAnalysis
Financialstatementanalysisisdefinedastheprocessofidentifyingfinancialstrengthsandweaknessesofthefirmbyproperlyestablishingrelationshipbetweentheitemsofthebalancesheetandtheincomestatement.Itistheprocessofreviewingandanalyzingacompany'sfinancialstatementstomakebettereconomicdecisions.
2.ObjectivesofFinancialStatementAnalysis
Theprimarypurposeoffinancialstatementanalysisistoevaluatetherisks,performance,financialhealth,andfutureprospectsofanorganization.
3.UsersofFinancialStatementAnalysis
(1)Creditors
Anyonewhohaslentfundstoacompanyisinterestedinitsabilitytopaybackthedebt,andsowillfocusonvariouscashflowmeasures.
(2)Investors
Bothcurrentandprospectiveinvestorsexaminefinancialstatementstolearnaboutacompany'sabilitytocontinueissuingdividends,ortogeneratecashflow,ortocontinuegrowingatitshistoricalrate.
(3)Management
Thecompanycontrollerpreparesanongoinganalysisofthecompany'sfinancialresults,particularlyinrelationtoanumberofoperationalmetricsthatarenotseenbyoutsideentities.
(4)Regulatoryauthorities
Ifacompanyispubliclyheld,itsfinancialstatementsareexaminedbytheSecuritiesandExchangeCommission(SEC);forexample,ifthecompanyfilesintheUnitedStatesthentoseeifitsstatementsconformtothevariousaccountingstandardsandtherulesoftheSEC.
4.ToolsofAnalysis
(1)TrendAnalysis:
Trendanalysisisthecomparisonoffinancialstatementinformationoveraseriesofreportingperiods.
(2)CommonSizeAnalysis:
CommonSizeanalysisisthereviewoftheproportionofaccountstoeachotherwithinasingleperiod.Common-sizebalancesheetsandincomestatementsareusedtocomparetheperformanceofdifferentcompaniesoracompany'sprogressovertime.
(3)Ratioanalysis:
Financialratiosaremathematicalcomparisonsoffinancialstatementaccountsorcategories.Theserelationshipsbetweenthefinancialstatementaccountshelptheusersofaccountinginformationtounderstandhowwellabusinessisperformingandofareasneedingimprovement.FinancialRatiosareusedastoolstohelpussqueezeasmuchinformationaspossiblefromthefinancialstatements.Itmustbekeptinmind;however,thatafinancialratioisonlyonenumberdividedbyanotherandonlyyieldsanumberandittakesonmeaningwhencomparedwithotherfirmsorindustryaverage.
Topic2:
RatioComputationsandInterpretations
Ratiosweredevelopedtostandardizeacompany'sresults.Theyallowanalyststoquicklylookthroughacompany'sfinancialstatementsandidentifytrendsandanomalies.Ratioscanbeclassifiedintermsoftheinformationtheyprovidetothereader.Thereareseveralgeneralcategoriesofratios,eachdesignedtoexamineadifferentaspectofacompany'sperformance.Forexample,VinHuaisconsideringaninvestmentinoneofthetwofastfoodrestaurantchainsbecausehebelievesthetrendtowardeatingoutmoreoftenwillcontinue.HischoiceshavenarrowedtoFastSandwichandGiantPizza,whosebalancesheetsandincomestatementsfollow:
BalanceSheet
(inthousands)
Assets
FastSandwich
GiantPizza
Cash
$2,000
$4,500
AccountsReceivables(net)
2000
6500
Inventory
2000
5000
Property,PlantandEquipment(net)
20000
35000
OtherAssets
4000
5000
TotalAssets
30000
$56,000
LiabilitiesandShareholders’Equity
Accountspayable
$2,500
$3,000
NotePayable
1500
4000
BondsPayable
10000
30000
CommonStock($1parvalue)
1000
3000
Paid-in-capitalinExcessofParValue,common
9000
9000
RetainedEarnings
6000
7000
TotalLiabilitiesandShareholders’Equity
$30,000
$56,000
Marketpricepershare
$30
$20
IncomeStatements
(inthousands,exceptpershare)
FastSandwich
GiantPizza
NetSales
$53,000
$86,000
CostofGoodsSold(restaurantopeningoperatingexpenses)
37000
61000
GrossMargin
16000
25000
Sellingexpense'
7000
10000
Administrativeexpenses
4000
5000
Interestexpenses
1400
3200
Incometaxesexpense
1800
3400
TotalOperatingExpense
14200
21600
NetIncome
1800
3400
EarningsPerShare
1.8
1.13
Basedontheabovecomparativebalancesheetandincomestatementsoftwocompanies,wewillexplaintheseratiosthroughoutthissection.
(1)ProfitabilityRatio:
Herearesomeofthekeyratiosthatinvestorsandcreditorsconsiderwhenjudginghowprofitableacompanyshouldbe
ØGrossMarginRatio
Thisshowstheaverageamountofprofitconsideringonlysalesandthecostoftheitemssold.Thistellshowmuchprofittheproductorserviceismakingwithoutoverheadconsiderations.Assuch,itindicatestheefficiencyofoperationsaswellashowproductsarepriced.Widevariationsoccurfromindustrytoindustry.Itindicatesthegrossmargingeneratedforeachdollarinnetsales.
Formula:
Grossmarginratio=Grossmargin
Netsales
Where:
Grossmargin=Netsales-Costofgoodssold
Calculation:
FastSandwich=
=30%
GiantPizza=
=29%
Interpretation:
Asyoucansee,FastSandwichhasaratioof30%,veryneartoGiantPizza,29%.Thesearehighratiointherestaurantindustry.Thismeansthatafterpaysoffhisinventorycosts,companyhasofitssalesrevenuetocoverhisoperatingcosts.
ØNetMarginRatio
TheNetmarginorprofitmarginratiodirectlymeasureswhatpercentageofsalesismadeupofnetincome.Inotherwords,itmeasureshowmuchprofitsareproducedatacertainlevelofsales.Thisratioalsoindirectlymeasureshowwellacompanymanagesitsexpensesrelativetoitsnetsales.Thatiswhycompaniesstrivetoachievehigherratios.Theycandothisbyeithergeneratingmorerevenueswhykeepingexpensesconstantorkeeprevenuesconstantandlowerexpenses.Likemostprofitabilityratios,thisratioisbestusedtocomparelikesizedcompaniesinthesameindustry.Thisratioisalsoeffectiveformeasuringpastperformanceofacompany.
Formula:
Netmarginratio=Netincome
Netsales
Calculation:
FastSandwich=
=3.4%
GiantPizza=
=4.0%
Interpretation:
Asyoucansee,FastSandwichonlyconverted3.4percentofitssalesintoprofits.Contrastthatwiththiscompany,GiantPizzahasalsoonly4%of$86,000ofnetsalesand$3400ofnetincome.Thisyearbothmayhavemadefewersalesbuttheycancutexpensesandcanbeabletoconvertmoreofthesesalesintoprofitsinfuture.
ØReturnonAssets(ROA)
Thisratiomeasurestheoperatingefficacyofacompanywithoutregardstofinancialstructureandindicateshowmuchnetincomewasgeneratedfromeachdollarinaverageassetsinvested.
Formula:
Returnonassets=Netincome
Averagetotalassets
Where:
Averagetotalassets=(Previouslyreportedtotalassets+currenttotalassets)
2
Calculation:
FastSandwich=
=6.0%
GiantPizza=
=6.1%
Interpretation:
Asyoucansee,herealsobothcompanieshaveverysimilaramountofreturnsfromassets.
ØReturnonCommonShareholders’Equity
Thisratiomeasuresthereturnaccruingtocommonshareholdersandexcludespreferredshareholders.
Formula:
Returnoncommonshareholders’equity=(Netincome-preferreddividends)
Averagecommonshareholders’equity
Where:
Averagecommonequity=(previouslyreportedcommonshareholders’equity+currentcommonshareholders’equity)/2.
Calculation:
FastSandwich=
=11.3%
GiantPizza=
=17.9%
Interpretation:
Asyoucansee,theprofitabilityofshareholdersinvestmentsbetweenthetwocompaniesarevarieswiththesimilaramountofinvestment.GiantPizzaperformsbetterthantheFastSandwichinthiscase.
ØEarningsPerShare(EPS)
Earningspershare,alsocallednetincomepershare,isamarketprospectratiothatmeasurestheamountofnetincomeearnedpershareofstockoutstanding.Higherearningspersharearealwaysbetterthanalowerratiobecausethismeansthecompanyismoreprofitableandthecompanyhasmoreprofitstodistributetoitsshareholders.Mostofthetime,earningpershareiscalculatedforyear-endfinancialstatements.Sincecompaniesoftenissuenewstockandbuybacktreasurystockthroughouttheyear,theweightedaveragecommonsharesareusedinthecalculation.Theweightedaveragecommonsharesoutstandingiscanbesimplifiedbyaddingthebeginningandendingoutstandingsharesanddividingbytwo.
Formula:
Earningspershare=(Netincome-preferreddividends)
Weightedaveragenumberofsharesoutstanding
Where:
Weightedaveragenumberofsharesoutstanding=Thenumberofsharesoutstandingduringeachmonth,weightedbythenumberofmonthsthoseshareswereoutstanding.
Calculation:
FastSandwich=
=1.18
GiantPizza=
=1.13
Interpretation:
Asyoucansee,FastSandwichEPSfortheyearis$1.18.Thismeansthat
 升级会员
升级会员 