数据分析33.docx
《数据分析33.docx》由会员分享,可在线阅读,更多相关《数据分析33.docx(13页珍藏版)》请在冰豆网上搜索。
数据分析33
Question1
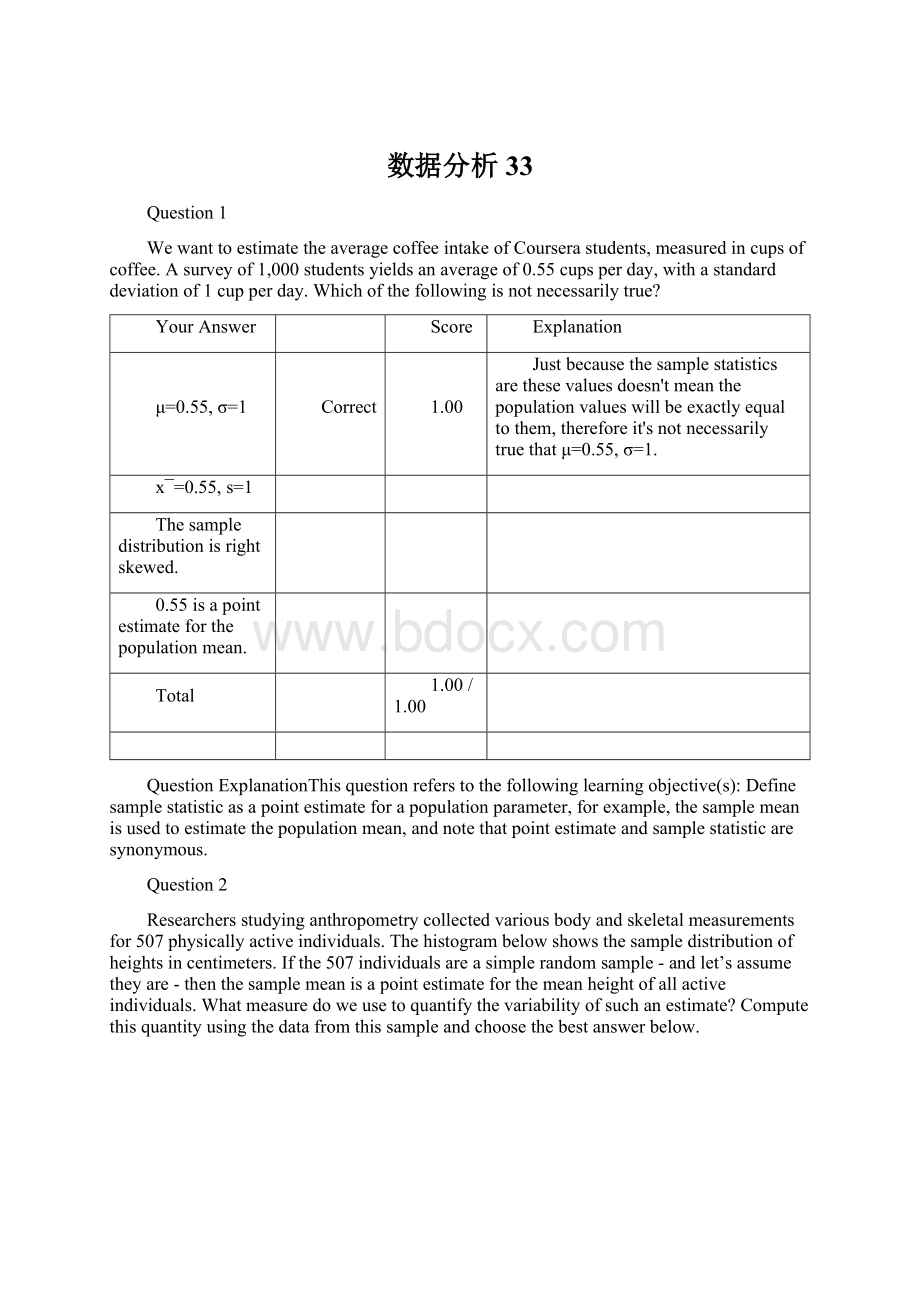
WewanttoestimatetheaveragecoffeeintakeofCourserastudents,measuredincupsofcoffee.Asurveyof1,000studentsyieldsanaverageof0.55cupsperday,withastandarddeviationof1cupperday.Whichofthefollowingisnotnecessarilytrue?
YourAnswer
Score
Explanation
μ=0.55,σ=1
Correct
1.00
Justbecausethesamplestatisticsarethesevaluesdoesn'tmeanthepopulationvalueswillbeexactlyequaltothem,thereforeit'snotnecessarilytruethatμ=0.55,σ=1.
x¯=0.55,s=1
Thesampledistributionisrightskewed.
0.55isapointestimateforthepopulationmean.
Total
1.00/1.00
QuestionExplanationThisquestionreferstothefollowinglearningobjective(s):
Definesamplestatisticasapointestimateforapopulationparameter,forexample,thesamplemeanisusedtoestimatethepopulationmean,andnotethatpointestimateandsamplestatisticaresynonymous.
Question2
Researchersstudyinganthropometrycollectedvariousbodyandskeletalmeasurementsfor507physicallyactiveindividuals.Thehistogrambelowshowsthesampledistributionofheightsincentimeters.Ifthe507individualsareasimplerandomsample-andlet’sassumetheyare-thenthesamplemeanisapointestimateforthemeanheightofallactiveindividuals.Whatmeasuredoweusetoquantifythevariabilityofsuchanestimate?
Computethisquantityusingthedatafromthissampleandchoosethebestanswerbelow.
YourAnswer
Score
Explanation
standarddeviation=0.417
standarderror=0.417
meansquarederror=0.105
standarddeviation=0.019
standarderror=0.019
Inorrect
0.00
Wequantifyvariabilityinthesamplemeanbycalculatingthestandarderror(ofthemean)SE=σ/n√.
Total
0.00/1.00
QuestionExplanationThisquestionreferstothefollowinglearningobjective(s):
Calculatethesamplingvariabilityofthemean,thestandarderror,asSE=σ/n√.
Question3
Thestandarderrormeasures:
YourAnswer
Score
Explanation
thevariabilityofsamplestatistics
thevariabilityofpopulationparameters
thevariabilityinthepopulation
thevariabilityofthesampledobservations
Inorrect
0.00
The``variabilityofthesampledobservations"ismeasuredbythesamplestandarddeviations.
Total
0.00/1.00
QuestionExplanationThisquestionreferstothefollowinglearningobjective(s):
Distinguishstandarddeviation(σors)andstandarderror(SE):
standarddeviationmeasuresthevariabilityinthedata,whilestandarderrormeasuresthevariabilityinpointestimatesfromdifferentsamplesofthesamesizeandfromthesamepopulation,i.e.measuresthesamplingvariability.
Question4
Supposeyoutookalargenumberofrandomsamplesofsizenfromalargepopulationandcalculatedthemeanofeachsample.Thensupposeyouplottedthedistributionofyoursamplemeansinahistogram.Nowconsiderthefollowingpossibleattributesofyourcollecteddataandthepopulationfromwhichtheyweresampled.Forwhichofthefollowingsetsofattributeswouldyounotexpectyourhistogramofyoursamplemeanstofollowanearlynormaldistribution?
YourAnswer
Score
Explanation
n=120.Thepopulationdistributionisunknown,butthedistributionofdataineachsampleisslightlyskewed.
n=20.Thepopulationdistributionisnearlynormal.
n=120.Thepopulationdistributionisslightlyskewed.
n=10.Thepopulationdistributionisunknown,butthedistributionofdataineachsampleisheavilyskewed.
Correct
1.00
Samplesizeissmallandthepopulationdistributionmightbeskewed,hencelikelynotgoingtoyieldnearlynormalsamplingdistribution.
Total
1.00/1.00
QuestionExplanationThisquestionreferstothefollowinglearningobjective(s):
RecognizethattheCentralLimitTheorem(CLT)isaboutthedistributionofpointestimates,andthatgivencertainconditions,thisdistributionwillbenearlynormal.
InthecaseofthemeantheCLTtellsusthatif
(1a)thesamplesizeissufficientlylarge(n≥30)andthedataarenotextremelyskewedor
(1b)thepopulationisknowntohaveanormaldistribution,and
(2)theobservationsinthesampleareindependent,
thenthedistributionofthesamplemeanwillbenearlynormal,centeredatthetruepopulationmeanandwithastandarderrorofσn√.x¯∼N(mean=μ,SE=σn√)
∙Whenthepopulationdistributionisunknown,condition(1a)canbecheckedusingahistogramorsomeothervisualizationofthedistributionoftheobserveddatainthesample.
∙Thelargerthesamplesize(n),thelessimportanttheshapeofthedistributionbecomes,i.e.whennisverylargethesamplingdistributionwillbenearlynormalregardlessoftheshapeofthepopulationdistribution.
Question5
TheGeneralSocialSurvey(GSS)isasociologicalsurveyusedtocollectdataondemographiccharacteristicsandattitudesofresidentsoftheUnitedStates.In2010,thesurveycollectedresponsesfromoverathousandUSresidents.Thesurveyisconductedface-to-facewithanin-personinterviewofarandomly-selectedsampleofadults.Oneofthequestionsonthesurveyis“Forhowmanydaysduringthepast30dayswasyourmentalhealth,whichincludesstress,depression,andproblemswithemotions,notgood?
”
Basedonresponsesfrom1,151USresidents,thesurveyreporteda95%confidenceintervalof3.40to4.24daysin2010.Giventhisinformation,whichofthefollowingstatementswouldbemostappropriatetomakeregardingthetrueaveragenumberofdaysof“notgood”mentalhealthin2010forUSresidents?
YourAnswer
Score
Explanation
ForallUSresidentsin2010,thereisa95%probabilitythatthetrueaveragenumberofdaysof“notgood”mentalhealthisbetween3.40and4.24days.
ForallUSresidentsin2010,basedonthis95%confidenceinterval,wewouldrejectanullhypothesisstatingthatthetrueaveragenumberofdaysof“notgood”mentalhealthis5days.
Thereisnotsufficientinformationtocalculatethemarginoferrorofthisconfidenceinterval.
Forthese1,151residentsin2010,weare95%confidentthattheaveragenumberofdaysof“notgood”mentalhealthisbetween3.40and4.24days.
Inorrect
0.00
Theconfidenceintervalsonlytrytocapturepopulationparameters,notsamplemeans.Wecancalculateexactlywhatthesamplemeanis.
Total
0.00/1.00
QuestionExplanationThisquestionreferstothefollowinglearningobjective(s):
∙Interpretaconfidenceintervalas“WeareXX%confidentthatthetruepopulationparameterisinthisinterval”,whereXX%isthedesiredconfidencelevel.
∙Definemarginoferrorasthedistancerequiredtotravelineitherdirectionawayfromthepointestimatewhenconstructingaconfidenceinterval.
Question6
Astudysuggeststhattheaveragecollegestudentspends2hoursperweekcommunicatingwithothersonline.Youbelievethatthisisanunderestimateanddecidetocollectyourownsampleforahypothesistest.Yourandomlysample60studentsfromyourdormandfindthatonaveragetheyspent3.5hoursaweekcommunicatingwithothersonline.Whichofthefollowingisthecorrectsetofhypothesesforthisscenario?
YourAnswer
Score
Explanation
H0:
μ=2HA:
μ>2
Correct
1.00
H0:
μ=2HA:
μ<2
H0:
μ=3.5HA:
μ<3.5
H0:
x¯=2HA:
x¯<2
H0:
x¯=2HA:
x¯>2
Total
1.00/1.00
QuestionExplanationThisquestionreferstothefollowinglearningobjective(s):
∙Alwaysconstructhypothesesaboutpopulationparameters(e.g.populationmean,μ)andnotthesamplestatistics(e.g.samplemean,x¯).Notethatthepopulationparameterisunknownwhilethesamplestatisticismeasuredusingtheobserveddataandhencethereisnopointinhypothesizingaboutit.
∙Definethenullvalueasthevaluetheparameterissettoequalinthenullhypothesis.
∙Notethatthealternativehypothesismightbeone-sided(μthenullvalue)ortwo-sided(μ≠thenullvalue),andthechoicedependsontheresearchquestion.
Question7
Whichofthefollowingisthecorrectdefinitionofthep-value?
YourAnswer
Score
Explanation
P(observedormoreextremesamplestatistic|H0true)
P(H0true)
P(H0true|HAfalse)
P(H0true|observeddata)
Inorrect
0.00
Reviewtheassociatedlearningobjective.Thissoundsmoreliketheposteriorprobability:
P(hypothesis|data).
Total
0.00/1.00
QuestionExplanationThisquestionreferstothefollowinglearningobjective(s):
Defineap-valueastheconditionalprobabilityofobtainingasamplestatisticatleastasextremeastheoneobservedgiventhatthenullhypothesisistrue.
p-value=P(observedormoreextremesamplestatistic|H0true)
Question8
Allbutoneofthefollowingconfidenceintervalshasamarginoferrorof0.7.Whichistheconfidenceintervalwiththedifferentmarginoferror?
YourAnswer
Score
Explanation
(−4.7,−3.3)
(1.6,4.4)
Correct
1.00
Thewidthofaconfidenceintervalis2timesthemarginoferror,sinceweaddandsubtractthesamemarginoferrortothesamplestatisticstoobtaintheboundsoftheconfidenceinterval.Tosolvethisquestionweneedtocalculatethemarginoferrorusingthisruleforeachchoice:
|(1.6−4.4)/2|=1.4
(20.3,21.7)
(−0.5,0.9)
Total
1.00/1.00
QuestionExplanationThisquestionreferstothefollowinglearningobjective(s):
∙Recognizethatwhenthesamplesizeincreaseswewouldexpectthesamplingvariabilitytodecrease.
∙Definemarginoferrorasthedistancerequiredtotravelineitherdirectionawayfromthepointestimatewhenconstructingaconfidenceinterval,i.e.z⋆×SE.
Question9
Aresearcherfounda2006-2010surveyshowingthattheaverageageof
 升级会员
升级会员 