试验与数据处理作业.docx
《试验与数据处理作业.docx》由会员分享,可在线阅读,更多相关《试验与数据处理作业.docx(23页珍藏版)》请在冰豆网上搜索。

试验与数据处理作业
实验设计与数据处理课后题作业
机械工程包装工程09硕任艳玲S0
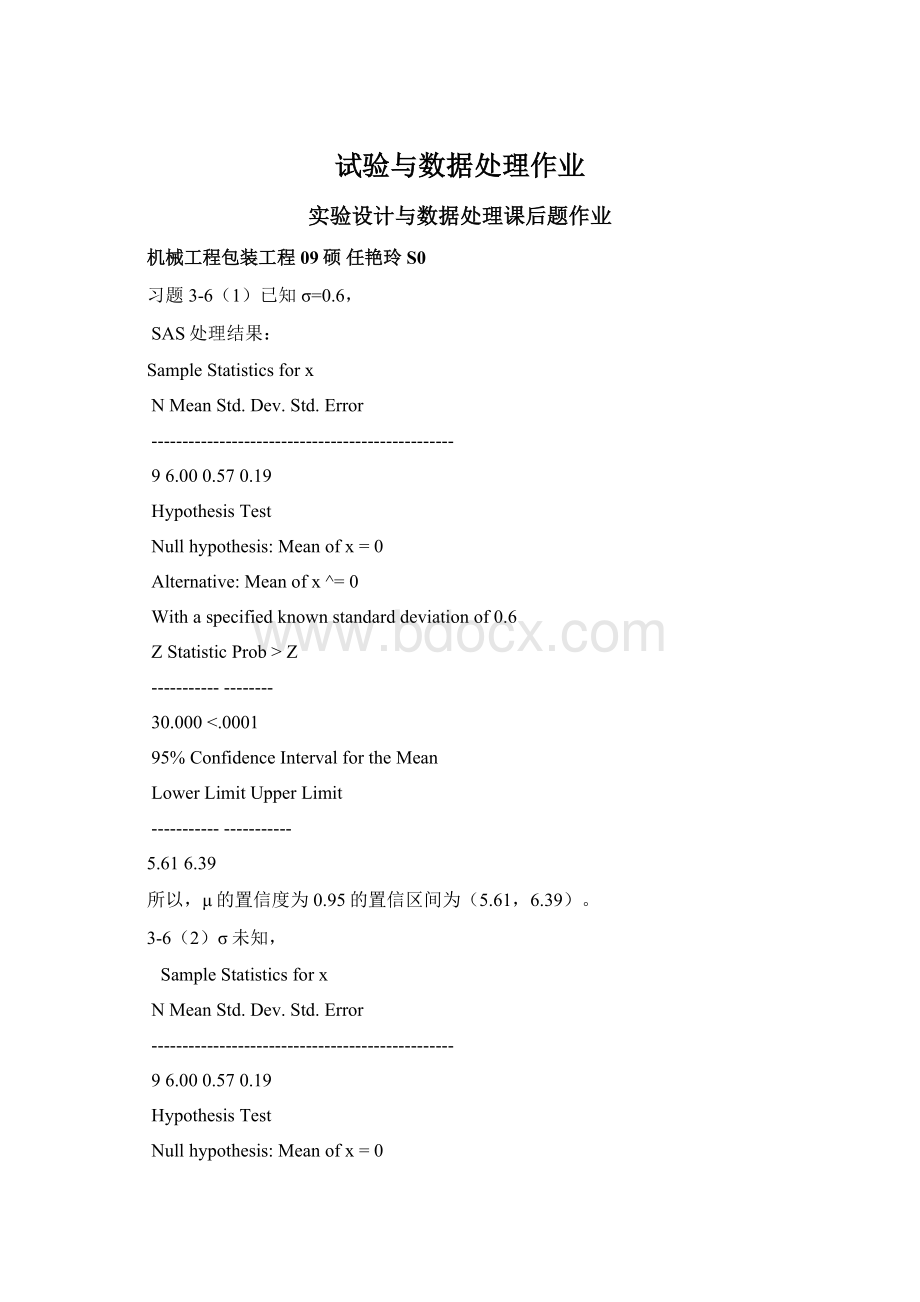
习题3-6
(1)已知σ=0.6,
SAS处理结果:
SampleStatisticsforx
NMeanStd.Dev.Std.Error
-------------------------------------------------
96.000.570.19
HypothesisTest
Nullhypothesis:
Meanofx=0
Alternative:
Meanofx^=0
Withaspecifiedknownstandarddeviationof0.6
ZStatisticProb>Z
-------------------
30.000<.0001
95%ConfidenceIntervalfortheMean
LowerLimitUpperLimit
----------------------
5.616.39
所以,μ的置信度为0.95的置信区间为(5.61,6.39)。
3-6
(2)σ未知,
SampleStatisticsforx
NMeanStd.Dev.Std.Error
-------------------------------------------------
96.000.570.19
HypothesisTest
Nullhypothesis:
Meanofx=0
Alternative:
Meanofx^=0
tStatisticDfProb>t
---------------------------------
31.3348<.0001
95%ConfidenceIntervalfortheMean
LowerLimit:
5.56
UpperLimit:
6.44
所以,μ的置信度为0.95的置信区间为(5.56,6.44)。
习题3-7
(1)
SampleStatisticsforx
NMeanStd.Dev.Std.Error
-------------------------------------------------
66.680.000.00
HypothesisTest
Nullhypothesis:
Meanofx=0
Alternative:
Meanofx^=0
tStatisticDfProb>t
---------------------------------
4228.3445<.0001
90%ConfidenceIntervalfortheMean
LowerLimit:
6.67
UpperLimit:
6.68
因此,μ的置信度为0.9的置信区间(6.67,6.68)。
SampleStatisticsforx
NMeanStd.Dev.Variance
---------------------------------------------
66.67820.003915E-6
HypothesisTest
Nullhypothesis:
Varianceofx=1
Alternative:
Varianceofx^=1
Chi-squareDfProb
---------------------------------
0.0005<.0001
90%ConfidenceIntervalfortheVariance
LowerLimitUpperLimit
----------------------
676E-80.0001
因此,σ的置信度为0.9的置信区间(676E-8,0.0001)。
(2)SampleStatisticsforx
NMeanStd.Dev.Std.Error
-------------------------------------------------
56.660.000.00
HypothesisTest
Nullhypothesis:
Meanofx=0
Alternative:
Meanofx^=0
tStatisticDfProb>t
---------------------------------
4967.0524<.0001
90%ConfidenceIntervalfortheMean
LowerLimit:
6.66
UpperLimit:
6.67
因此,μ置信度为0.9的的置信区间(6.66,6.67)。
SampleStatisticsforx
NMeanStd.Dev.Variance
---------------------------------------------
56.6640.0039E-6
HypothesisTest
Nullhypothesis:
Varianceofx=1
Alternative:
Varianceofx^=1
Chi-squareDfProb
---------------------------------
0.0004<.0001
90%ConfidenceIntervalfortheVariance
LowerLimitUpperLimit
----------------------
379E-8507E-7
因此,σ的置信度为0.9的置信区间(379E-8,507E-7)。
习题3-10SampleStatisticsforx
NMeanStd.Dev.Std.Error
-------------------------------------------------
53.250.010.01
HypothesisTest
Nullhypothesis:
Meanofx=3.25
Alternative:
Meanofx^=3.25
tStatisticDfProb>t
---------------------------------
0.34340.7489
说明:
因为在t检验中p-value值0.7489>0.01(显著性水平),所以接受原假设,即这批矿砂的镍含量的均值为3.25。
习题3-11
解:
按题意需检验假设
H0:
μ≥1000,H1:
μ<1000
这是左边检验问题,
=950,μ0=1000
U=(
-μ0)/(σ/
)=-2.5<-μ0.95=-1.645,U的值落在拒绝域内,所以我们在显著性水平0.05下拒绝H0,即这批元件不合格。
习题3-13
SampleStatistics
GroupNMeanStd.Dev.Std.Error
----------------------------------------------------
x80.2318750.01460.0051
y100.20970.00970.0031
HypothesisTest
Nullhypothesis:
Mean1-Mean2=0
Alternative:
Mean1-Mean2^=0
IfVariancesAretstatisticDfPr>t
----------------------------------------------------
Equal3.878160.0013
NotEqual3.70411.670.0032
说明:
因为在t检验中p-value值0.0013<0.05(显著性水平),所以拒绝原假设,即认为两个作家所写的小品文中包含由3个字母组成的词的比例有显著的差异。
习题3-14
SampleStatistics
GroupNMeanStd.Dev.Variance
--------------------------------------------------
x80.2318750.01460.000212
y100.20970.00970.000093
HypothesisTest
Nullhypothesis:
Variance1/Variance2=1
Alternative:
Variance1/Variance2^=1
-DegreesofFreedom-
FNumer.Denom.Pr>F
----------------------------------------------
2.27790.2501
说明:
因为在F检验中p-value值0.2501>0.05(显著性水平),所以接受原假设,即认为两总体方差无显著性差异。
习题4-1
TheANOVAProcedure
ClassLevelInformation
ClassLevelsValues
c512345
Numberofobservations20
TheANOVAProcedure
DependentVariable:
y
Sumof
SourceDFSquaresMeanSquareFValuePr>F
Model41480.823000370.20575040.88<.0001
Error15135.8225009.054833
CorrectedTotal191616.645500
R-SquareCoeffVarRootMSEyMean
0.91598513.120233.00912522.93500
SourceDFAnovaSSMeanSquareFValuePr>F
c41480.823000370.20575040.88<.0001
由于Pr>F,且概率小于0.0001,即小于0.01,说明这些抗生素百分比的均值有高度显著差异。
习题4-2
TheGLMProcedure
ClassLevelInformation
ClassLevelsValues
浓度C3123
温度T41234
Numberofobservations24
TheGLMProcedure
DependentVariable:
R
Sumof
SourceDFSquaresMeanSquareFValuePr>F
Model1182.83333337.53030301.390.2895
Error1265.00000005.4166667
CorrectedTotal23147.8333333
R-SquareCoeffVarRootMSEMean
0.56031622.342782.32737310.41667
SourceDFFactoidSSMeanSquareFValuePr>F
C244.22.4.090.0442
T311.3.0.710.5657
C*T627.000000004.0.830.5684
由于浓度C的Pr>F,且概率为0.0442,小于0.05,说明浓度C的作用是显著的。
而温度T的Pr为0.5657,大于0.05,
C*T的Pr为0.5684,大于0.05,说明温度与温度和浓度的交互作用都是不显著的。
习题5-3解:
用L9(34)确定配比试验方案。
如表所示
试验方案
因素
试验号
A
B
C
D
1
2
3
4
5
6
7
8
9
1(0.1份)
1
1
2(0.3份)
2
2
3(0.2份)
3
3
1(0.3份)
2(0.4份)
3(0.5份)
1
2
3
1
2
3
1(0.2份)
2(0.1份)
3(0.1份)
2
3
1
3
1
2
1(0.5份)
2(0.3份)
3(0.1)
3
1
2
2
3
1
以1号条件为例,表中四个数值的组成比为:
A:
B:
C:
D=0.1:
0.3:
0.2:
0.5
配比方案中,要求各行四个比值之和为1。
在1号条件中,四种数值分别是
A=0.1ⅹ
=0.091
B=0.3ⅹ
=0.272
C=0.2ⅹ
=0.182
D=0.5ⅹ
=0.455
其余实验条件可按照相同方法得出。
习题6-5
(1)散点图如下:
(2)令t1=x;t2=x2,则转化为线性回归模型y=b0+b1t1+b2t2+ε
取因变量为三次抗压强度之和,即y=
SAS分析结果如下:
由结果可得模型方程为:
=19.0200+1.0149t1-0.0206t2,即回归方程为
=19.0200+1.0149x-0.0206x2+ε。
习题6-6
(1)采用逐步回归法,SAS运行结果如下:
TheREGProcedure
Model:
MODEL1
DependentVariable:
y
StepwiseSelection:
Step1
Variablex3Entered:
R-Square=0.6216andC(p)=14.7345
AnalysisofVariance
SumofMean
SourceDFSquaresSquareFValuePr>F
Model110.5800010.580009.860.0201
Error66.440001.07333
CorrectedTotal717.02000
ParameterStandard
VariableEstimateErrorTypeIISSFValuePr>F
Intercept9.900000.36629784.08000730.51<.0001
x31.150000.3662910.580009.860.0201
Boundsonconditionnumber:
1,1
------------------------------------------------------------------------------------------------------
StepwiseSelection:
Step2
Variablex1Entered:
R-Square=0.7770andC(p)=9.0400
AnalysisofVariance
SumofMean
SourceDFSquaresSquareFValuePr>F
Model213.225006.612508.710.0235
Error53.795000.75900
CorrectedTotal717.02000
ParameterStandard
VariableEstimateErrorTypeIISSFValuePr>F
Intercept9.900000.30802784.080001033.04<.0001
x10.575000.308022.645003.480.1209
x31.150000.3080210.5800013.940.0135
TheREGProcedure
Model:
MODEL1
DependentVariable:
y
StepwiseSelection:
Step2
Boundsonconditionnumber:
1,4
------------------------------------------------------------------------------------------------------
StepwiseSelection:
Step3
Variablex2Entered:
R-Square=0.9192andC(p)=4.0000
AnalysisofVariance
SumofMean
SourceDFSquaresSquareFValuePr>F
Model315.645005.2150015.170.0119
Error41.375000.34375
CorrectedTotal717.02000
ParameterStandard
VariableEstimateErrorTypeIISSFValuePr>F
Intercept9.900000.20729784.080002280.96<.0001
x10.575000.207292.645007.690.0501
x20.550000.207292.420007.040.0568
x31.150000.2072910.5800030.780.0052
Boundsonconditionnumber:
1,9
------------------------------------------------------------------------------------------------------
Allvariablesleftinthemodelaresignificantatthe0.1500level.
Allvariableshavebeenenteredintothemodel.
SummaryofStepwiseSelection
VariableVariableNumberPartialModel
StepEnteredRemovedVarsInR-SquareR-SquareC(p)FValuePr>F
1x310.62160.621614.73459.860.0201
2x120.15540.77709.04003.480.1209
3x230.14220.91924.00007.040.0568
在а=0.1下,回归方程为:
=9.90+0.575x1+0.550x2+1.150x3。
(2)采用逐步回归法,SAS运行结果如下:
TheREGProcedure
Model:
MODEL1
DependentVariable:
y
StepwiseSelection:
Step1
Variablex3Entered:
R-Square=0.6216andC(p)=14.7345
AnalysisofVariance
SumofMean
SourceDFSquaresSquareFValuePr>F
Model110.5800010.580009.860.0201
Error66.440001.07333
CorrectedTotal717.02000
ParameterStandard
VariableEstimateErrorTypeIISSFValuePr>F
Intercept9.900000.36629784.08000730.51<.0001
x31.150000.3662910.580009.860.0201
Boundsonconditionnumber:
1,1
------------------------------------------------------------------------------------------------------
Allvariablesleftinthemodelaresignificantatthe0.0500level.
Noothervariablemetthe0.0500significancelevelforentryintothemodel.
SummaryofStepwiseSelection
VariableVariableNumberPartialModel
StepEnteredRemovedVarsInR-SquareR-SquareC(p)FValuePr>F
1x310.62160.621614.73459.860.0201
在а=0.05下,回归方程为:
=9.90+1.150x3。
习题6-9TheREGProcedure
Model:
MODEL1
DependentVariable:
y
StepwiseSelection:
Step1
Variablex2Entered:
R-Square=0.2872andC(p)=12.2386
AnalysisofVariance
SumofMean
SourceDFSquaresSquareFValuePr>F
Model163.0471263.047125.640.0324
Error14156.4804811.17718
CorrectedTotal15219.52760
ParameterStandard
VariableEstimateErrorTypeIISSFValuePr>F
Intercept7.960381.64304262.3643923.470.0003
x20.086140.0362763.047125.640.0324
Boundsonconditionnumber:
1,1
-----------------------------------------------------