计量经济学作业.docx
《计量经济学作业.docx》由会员分享,可在线阅读,更多相关《计量经济学作业.docx(11页珍藏版)》请在冰豆网上搜索。

计量经济学作业
3.2
(1)用Eviews分析如下
DependentVariable:
Y
Method:
LeastSquares
Date:
12/01/14Time:
20:
25
Sample:
19942011
Includedobservations:
18
Variable
Coefficient
Std.Error
t-Statistic
Prob.
X2
0.135474
0.012799
10.58454
0.0000
X3
18.85348
9.776181
1.928512
0.0729
C
-18231.58
8638.216
-2.110573
0.0520
R-squared
0.985838
Meandependentvar
6619.191
AdjustedR-squared
0.983950
S.D.dependentvar
5767.152
S.E.ofregression
730.6306
Akaikeinfocriterion
16.17670
Sumsquaredresid
8007316.
Schwarzcriterion
16.32510
Loglikelihood
-142.5903
Hannan-Quinncriter.
16.19717
F-statistic
522.0976
Durbin-Watsonstat
1.173432
Prob(F-statistic)
0.000000
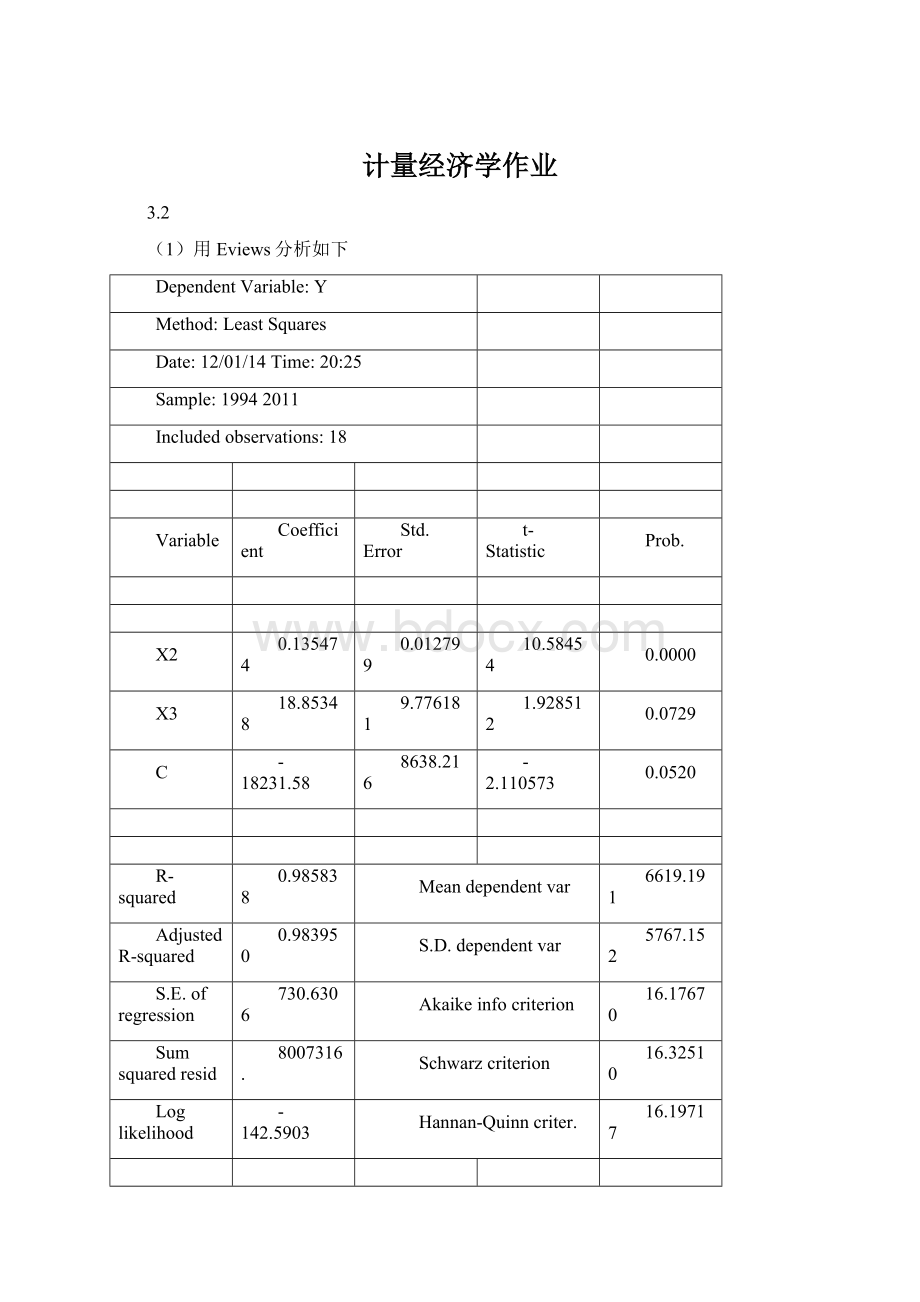
由表可知模型为:
Y=0.135474X2+18.85348X3-18231.58
检验:
可决系数是0.985838,修正的可决系数为0.983950,说明模型对样本拟合较好。
F检验,F=522.0976>F(2,15)=4.77,回归方程显著。
t检验,t统计量分别为X2的系数对应t值为10.58454,大于t(15)=2.131,系数是显著的,X3的系数对应t值为1.928512,小于t(15)=2.131,说明此系数是不显著的。
(2)
(2)表内数据ln后重新输入数据:
DependentVariable:
LNY
Method:
LeastSquares
Date:
10/25/15Time:
22:
18
Sample:
19942011
Includedobservations:
18
Variable
Coefficient
Std.Error
t-Statistic
Prob.
C
-10.81090
1.698653
-6.364397
0.0000
LNX2
1.573784
0.091547
17.19106
0.0000
X3
0.002438
0.000936
2.605321
0.0199
R-squared
0.986373
Meandependentvar
8.400112
AdjustedR-squared
0.984556
S.D.dependentvar
0.941530
S.E.ofregression
0.117006
Akaikeinfocriterion
-1.302176
Sumsquaredresid
0.205355
Schwarzcriterion
-1.153780
Loglikelihood
14.71958
Hannan-Quinncriter.
-1.281714
F-statistic
542.8930
Durbin-Watsonstat
0.684080
Prob(F-statistic)
0.000000
模型为lny=-10.81090+1.573784lnx2+0.002438x3
检验:
经济意义为其他条件不变的情况下,工业增加值每增加一个单位百分比出口货物总和增加1.57单位百分比,汇率每增加一单位百分比,出口总额增加0.0024个单位百分比。
拟合优度检验,R^2=0.986373修正可决系数为0.984556,拟合很好。
F检验对于H0:
X2=X3=0,给定显著性水平a=0.05F(2,15)=4.77F=542.8930>F(2,15)显著
t检验对于H0:
Xj=0(j=2,3),给定显著性水平a=0.05t(15)=2.131当j=2时t>t(15)显著,当j=3时t>t(15)显著。
(3)两个模型表现出的汇率对Y的印象存在巨大差异
3.3
(1)用Eviews分析如下
DependentVariable:
Y
Method:
LeastSquares
Date:
12/01/14Time:
20:
30
Sample:
118
Includedobservations:
18
Variable
Coefficient
Std.Error
t-Statistic
Prob.
X
0.086450
0.029363
2.944186
0.0101
T
52.37031
5.202167
10.06702
0.0000
C
-50.01638
49.46026
-1.011244
0.3279
R-squared
0.951235
Meandependentvar
755.1222
AdjustedR-squared
0.944732
S.D.dependentvar
258.7206
S.E.ofregression
60.82273
Akaikeinfocriterion
11.20482
Sumsquaredresid
55491.07
Schwarzcriterion
11.35321
Loglikelihood
-97.84334
Hannan-Quinncriter.
11.22528
F-statistic
146.2974
Durbin-Watsonstat
2.605783
Prob(F-statistic)
0.000000
由表可知模型为:
Y=0.086450X+52.37031T-50.01638
检验:
可决系数是0.951235,修正的可决系数为0.944732,说明模型对样本拟合较好。
F检验,F=539.7364>F(2,15)=4.77,回归方程显著。
t检验,t统计量分别为2.944186,10.06702,均大于t(15)=2.131,所以这些系数都是显著的。
经济意义:
家庭月平均收入增加1元,家庭书刊年消费支出增加0.086450元,户主受教育年数增加1年,家庭书刊年消费支出增加52.37031元。
(2)用Eviews分析如下
Y与T的一元回归
DependentVariable:
Y
Method:
LeastSquares
Date:
12/01/14Time:
22:
30
Sample:
118
Includedobservations:
18
Variable
Coefficient
Std.Error
t-Statistic
Prob.
T
63.01676
4.548581
13.85416
0.0000
C
-11.58171
58.02290
-0.199606
0.8443
R-squared
0.923054
Meandependentvar
755.1222
AdjustedR-squared
0.918245
S.D.dependentvar
258.7206
S.E.ofregression
73.97565
Akaikeinfocriterion
11.54979
Sumsquaredresid
87558.36
Schwarzcriterion
11.64872
Loglikelihood
-101.9481
Hannan-Quinncriter.
11.56343
F-statistic
191.9377
Durbin-Watsonstat
2.134043
Prob(F-statistic)
0.000000
模型:
Y=63.01676T-11.58171
X与T的一元回归
DependentVariable:
X
Method:
LeastSquares
Date:
12/01/14Time:
22:
34
Sample:
118
Includedobservations:
18
Variable
Coefficient
Std.Error
t-Statistic
Prob.
T
123.1516
31.84150
3.867644
0.0014
C
444.5888
406.1786
1.094565
0.2899
R-squared
0.483182
Meandependentvar
1942.933
AdjustedR-squared
0.450881
S.D.dependentvar
698.8325
S.E.ofregression
517.8529
Akaikeinfocriterion
15.44170
Sumsquaredresid
4290746.
Schwarzcriterion
15.54063
Loglikelihood
-136.9753
Hannan-Quinncriter.
15.45534
F-statistic
14.95867
Durbin-Watsonstat
1.052251
Prob(F-statistic)
0.001364
模型:
X=123.1516T+444.5888
(3)对残差模型进行分析,用Eviews分析如下
DependentVariable:
E1
Method:
LeastSquares
Date:
12/03/14Time:
20:
39
Sample:
118
Includedobservations:
18
Variable
Coefficient
Std.Error
t-Statistic
Prob.
E2
0.086450
0.028431
3.040742
0.0078
C
3.96E-14
13.88083
2.85E-15
1.0000
R-squared
0.366239
Meandependentvar
2.30E-14
AdjustedR-squared
0.326629
S.D.dependentvar
71.76693
S.E.ofregression
58.89136
Akaikeinfocriterion
11.09370
Sumsquaredresid
55491.07
Schwarzcriterion
11.19264
Loglikelihood
-97.84334
Hannan-Quinncriter.
11.10735
F-statistic
9.246111
Durbin-Watsonstat
2.605783
Prob(F-statistic)
0.007788
模型:
E1=0.086450E2+3.96e-14
参数:
斜率系数α为0.086450,截距为3.96e-14
(4)由上可知,β2与α2的系数是一样的。
回归系数与被解释变量的残差系数是一样的,它们的变化规律是一致的。
3.4
为了分析中国税收收入(Y)与国内生产总值(X2)、财政支出(X3)、商品零售价格指数(X4)的关系,利用1978~2007年的数据,用EViews作回归,部分结果如下:
表3回归结果
DependentVariable:
LNY
Method:
LeastSquares
Date:
06/30/13Time:
19:
39
Sample:
19782007
Includedobservations:
30
Variable
Coefficient
Std.Error
t-Statistic
Prob.
C
-2.755367
0.640080
(1)
0.0002
LNX2
0.451234
(2)
3.174831
0.0038
LNX3
0.627133
0.161566
(3)
0.0006
X4
(4)
0.005645
1.795567
0.0842
R-squared
0.987591
Meandependentvar
8.341376
AdjustedR-squared
(5)
S.D.dependentvar
1.357225
S.E.ofregression
(6)
Akaikeinfocriterion
-0.707778
Sumsquaredresid
0.662904
Schwarzcriterion
-0.520952
Loglikelihood
14.61668
F-statistic
(7)
Durbin-Watsonstat
0.616136
Prob(F-statistic)
0.000000
填补表中空缺数据:
(1)tc=
=4.304723
(2)=
=0.130789
(3)=
=3.881590
(4)=
=0.010136
(5)=
=
=0.986159
(6)S.Eofregression回归标准差=
=
=0.154783
(7)=
=
=689.751148
②分析回归结果:
根据图中数据,模型估计的结果写为:
=-2.755367+0.451234
+0.627133
+0.010136
1)拟合优度:
由上图数据可以得到,可决系数
=0.987591,修正的可决系数
=0.986159,这说明模型对样本的拟合很好。
2)F检验:
针对
,给定显著性水平
,在F分布表中查出自由度为k-1=3和n-k=26的临界值
=8.63。
由上图得到F=689.751148,由于F=689.751148>
,应拒绝原假设,说明回归方程显著,即国内生产总值、财政支出、商品零售价格指数等变量联合起来对中国税收收入有显著影响。
3)t检验:
由上图中的P值可以判断,在
的显著性水平下,与
、
、
估计值对应的P值小于
,表明对应解释变量对被解释变量影响显著。
在
的显著性水平下,与
估计值对应的P值小于
,表明对应解释变量对被解释变量影响显著。
③评估参数的经济意义:
当其他变量不改变时,国内生产总值每增加1%,中国税收收入增加0.451234%。
当其他变量不改变时,财政支出每增加1%,中国税收收入增加0.627133%。
当其他变量不改变时,商品零售价格指数每增加1%,中国税收收入增加0.010136%。