雅思写作小作文汇总.pdf
《雅思写作小作文汇总.pdf》由会员分享,可在线阅读,更多相关《雅思写作小作文汇总.pdf(29页珍藏版)》请在冰豆网上搜索。
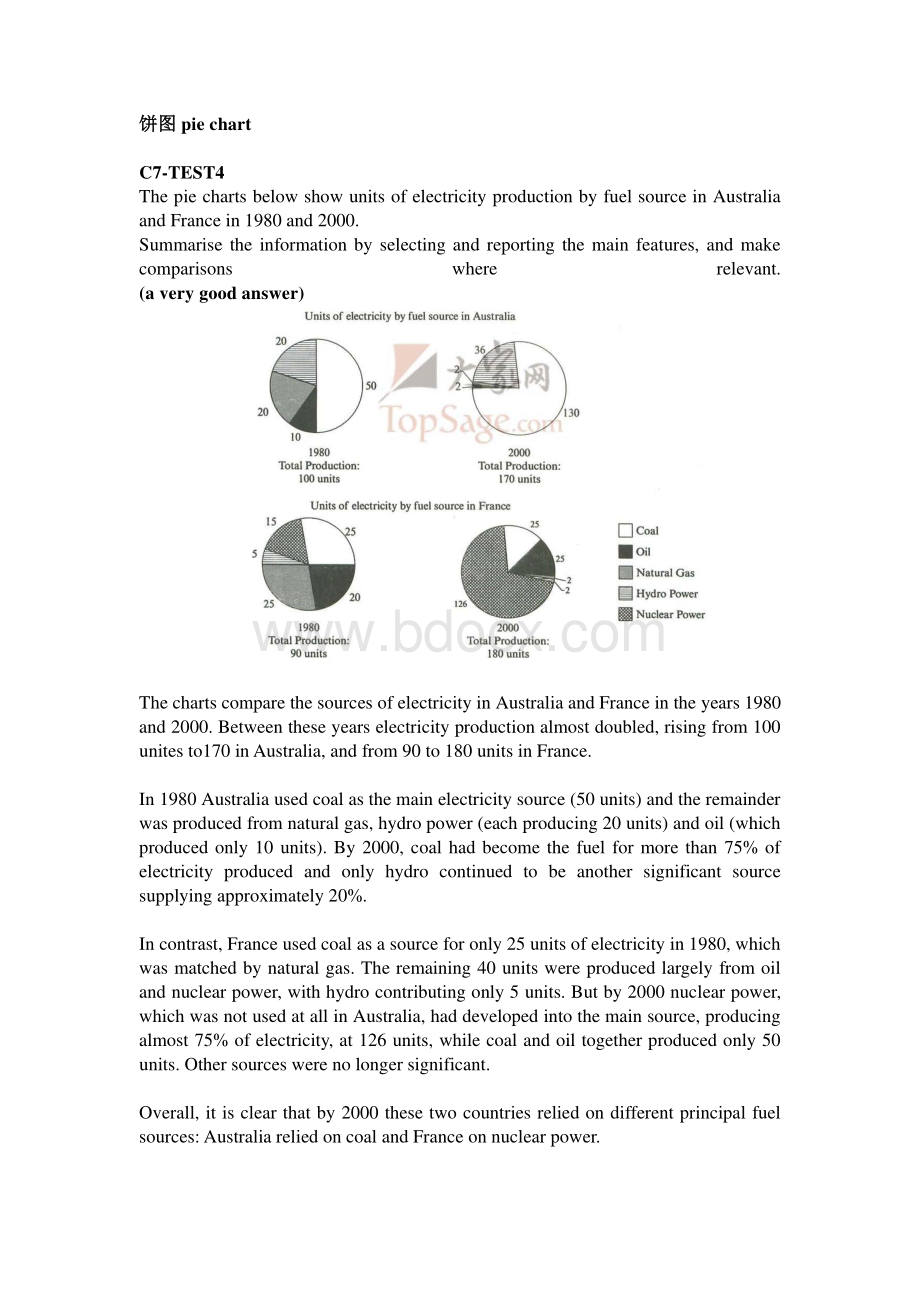
饼图饼图piechartC7-TEST4ThepiechartsbelowshowunitsofelectricityproductionbyfuelsourceinAustraliaandFrancein1980and2000.Summarisetheinformationbyselectingandreportingthemainfeatures,andmakecomparisonswhererelevant.(averygoodanswer)ThechartscomparethesourcesofelectricityinAustraliaandFranceintheyears1980and2000.Betweentheseyearselectricityproductionalmostdoubled,risingfrom100unitesto170inAustralia,andfrom90to180unitsinFrance.In1980Australiausedcoalasthemainelectricitysource(50units)andtheremainderwasproducedfromnaturalgas,hydropower(eachproducing20units)andoil(whichproducedonly10units).By2000,coalhadbecomethefuelformorethan75%ofelectricityproducedandonlyhydrocontinuedtobeanothersignificantsourcesupplyingapproximately20%.Incontrast,Franceusedcoalasasourceforonly25unitsofelectricityin1980,whichwasmatchedbynaturalgas.Theremaining40unitswereproducedlargelyfromoilandnuclearpower,withhydrocontributingonly5units.Butby2000nuclearpower,whichwasnotusedatallinAustralia,haddevelopedintothemainsource,producingalmost75%ofelectricity,at126units,whilecoalandoiltogetherproducedonly50units.Othersourceswerenolongersignificant.Overall,itisclearthatby2000thesetwocountriesreliedondifferentprincipalfuelsources:
AustraliareliedoncoalandFranceonnuclearpower.C8-TEST2ThethreepiechartsbelowshowthechangesinannualspendingbyaparticularUKschoolin1981,1991and2001.Summarisetheinformationbyselectingandreportingthemainfeatures,andmakecomparisonswhererelevant.(averygoodanswer)ThechartshowhowmuchaUKschoolspentondifferentrunningcostsinthreeseparateyears:
1981,1991and2001.Inallthreeyears,thegreatestexpenditurewasonstaffsalaries.Butwhileotherworkerssalariessawafallfrom28%in1981toonly15%ofspendingin2001,teacherspayremainedthebiggestcost,reaching50%oftotalspendingin1991andendingat45%in2001.Expenditureonresourcessuchasbookshadincreasedto20%by1991beforedecreasingtoonly9%bytheendoftheperiod.Incontrast,thecostoffurnitureandequipmentsawanoppositetrend.Thiscostdecreasedtoonly5%oftotalexpenditurein1991butrosedramaticallyin2001whenitrepresented23%oftheschoolbudget.Similarly,thecostofinsurancesawarisingtrend,growingfromonly2%to8%by2001.Overall,teacherssalariesconstitutedthelargestcosttotheschool,andwhilespendingincreaseddramaticallyforequipmentandinsurance,therewerecorrespondingdropsinexpenditureonthingssuchasbooksandonotherworkerssalaries.C8-TEST1Thepiechartbelowshowsthemainreasonswhyagriculturallandbecomeslessproductive.Thetableshowshowthesecausesaffectedthreeregionsoftheworldduringthe1990s.Summarisetheinformationbyselectingandreportingthemainfeatures,andmakecomparisonswhererelevant.(averygoodanswer)Thepiechartshowsthattherearefourmaincausesoffarmlandbecomingdegradedintheworldtoday.Globally,65%ofdegradationiscausedbytoomuchanimalgrazingandtreeclearance,constituting35%and30%respectively.Afurther28%ofglobaldegradationisduetoover-cultivationofcrops.Othercausesaccountforonly7%collectively.Thesecausesaffecteddifferentregionsdifferentlyinthe1990s,withEuropehavingasmuchas9.8%ofdegradation,whiletheimpactofthisonOceaniaandNorthAmericawasminimal,withonly1.7%and0.2%oflandaffectedrespectively.Europe,withthehighestoverallpercentageoflanddegradation(23%),alsosufferedfromover-cultivation(7.7%)andover-grazing(5.5%).Incontrast,Oceaniahad13%ofdegradedfarmlandandthiswasmainlyduetoover-grazing(11.3%).NorthAmericahadalowerproportionofdegradedlandatonly5%,andthemaincousesofthiswereover-cultivation(3.3%)and,toalesserextent,over-grazing(1.5%).Overall,itisclearthatEuropesufferedmorefromfarmlanddegradationthantheotherregions,andthemaincausesthereweredeforestationandover-cultivation.线图线图linegraphC3-TEST4ThegraphbelowshowstheunemploymentratesintheUSandJapanbetweenMarch1993andMarch1999.Writeareportforauniversitylecturer,describingtheinformationshownbelow.(7score)Accordingtotheresultsofthelabor-forceresearchpublishedrecently,thefollowingconclusionscanbedrawfromit:
InMarch,1993,UnitedStateshadsevenpercentoftheirworkforcewhichmightnotseemdisastrousuntilcomparedwithJapan,where2.5%wereunemployed.However,theunemploymentrateinUnitedStatesbegandecliningslowlysinceMarch1993,andreached5%markinthemiddleof1996.Japanturnedouttobelesslucky,astheirunemploymentratedoubledinthreeyears.Fromthenon,thepercentageofunemployedworkforceinUnitedStatesremainedroughlythesameabout5%untilMarch99,althoughtherewereminorfallsandri
 升级会员
升级会员 