图像处理实验1234.docx
《图像处理实验1234.docx》由会员分享,可在线阅读,更多相关《图像处理实验1234.docx(27页珍藏版)》请在冰豆网上搜索。

图像处理实验1234
图像处理实验1234
实验一Matlab基本运算
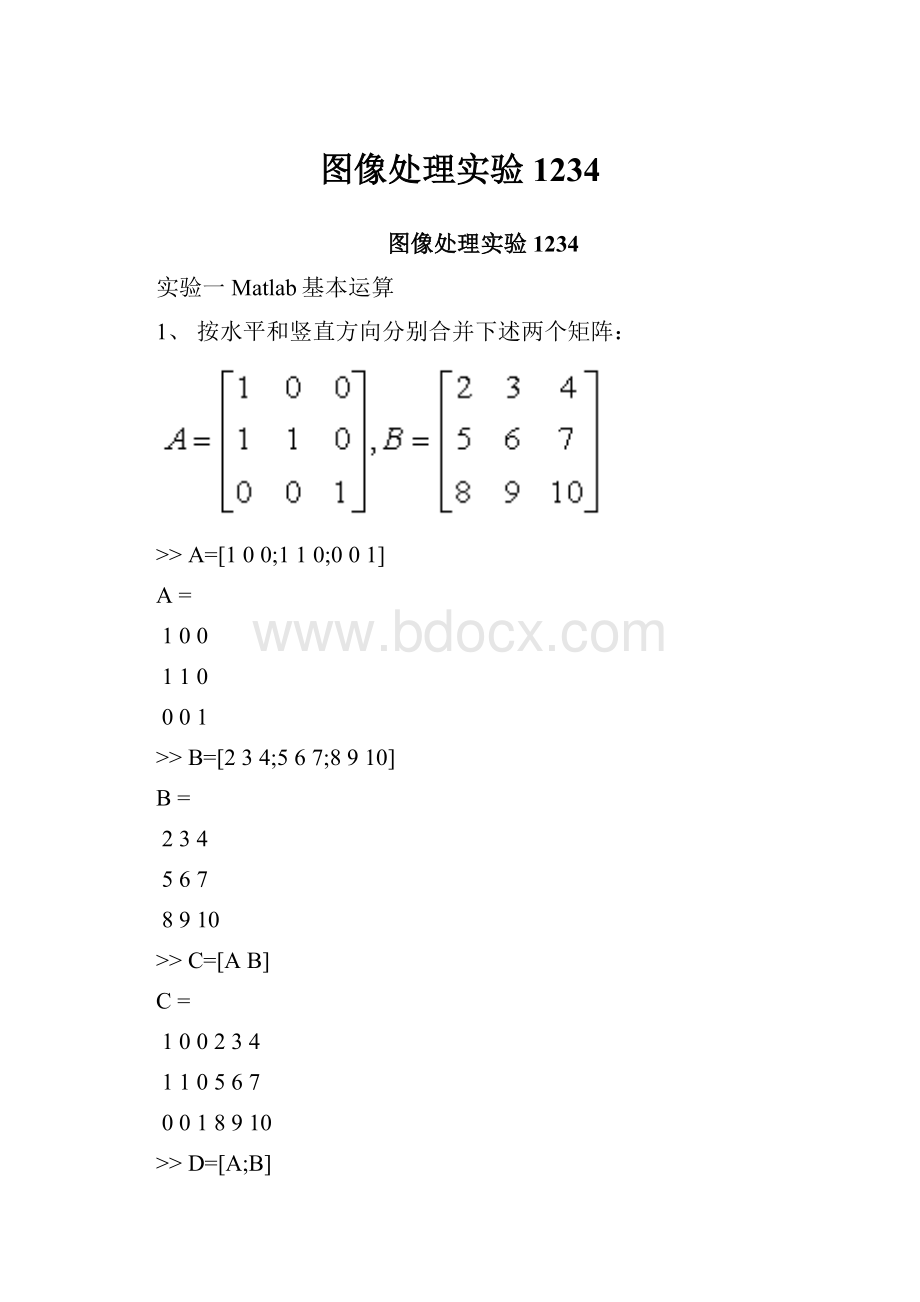
1、按水平和竖直方向分别合并下述两个矩阵:
>>A=[100;110;001]
A=
100
110
001
>>B=[234;567;8910]
B=
234
567
8910
>>C=[AB]
C=
100234
110567
0018910
>>D=[A;B]
D=
100
110
001
234
567
8910
(1)分别删除上述两个结果的第2行。
>>C(2,:
)=[]
C=
100234
0018910
>>D(2,:
)=[]
D=
100
001
234
567
8910
(2)分别将上述两个结果的第2行最后3列的数值
改为[111213]。
>>C(2,4:
6)=[111213]
C=
100234
001111213
>>D(2,:
)=[111213]
D=
100
111213
234
567
8910
(3)分别查看上述两个结果的各方向长度。
>>C_SIZE=size(C)
C_SIZE=
26
>>D_SIZE=size(D)
D_SIZE=
53
(4)分别计算上述矩阵A和B的A+B、A.*B、A./B和A\B,分析结果。
>>AB1=A+B
AB1=
334
677
8911
>>AB2=A.*B
AB2=
200
560
0010
>>AB3=A./B
AB3=
0.500000
0.20000.16670
000.1000
>>AB4=A\B
AB4=
234
333
8910
(5)计算矩阵A和B的A&B、A|B、~A和~B,分析结果。
>>AB5=A&B
AB5=
100
110
001
>>AB6=A|B
AB6=
111
111
111
>>AB7=~B
AB7=
000
000
000
>>AB8=~A
AB8=
011
001
110
(6)判断上述矩阵A和B中哪些元素值不小于4。
>>A.*(A>=4)
ans=
000
000
000
>>B.*(B>=4)
ans=
004
567
8910
2、下面是Matlab中有关图像读出、显示和保存函数使用的一段代码:
f=imread(‘filename’);
[M,N]=size(f);
imshow(f);
imwrite(f,‘filename.jpg’)
>>f=imread('filename.jpg');
>>[M,N]=size(f);
>>imshow(f);
Warning:
Imageistoobigtofitonscreen;displayingat56%scale.
>Intruesize>Resize1at308
Intruesizeat44
Inimshowat161
>>imwrite(f,'filename.jpg')
各函数的详细使用方法,请各位查看Matlab中的帮助,使用“help函数名”即可以查看函数的使用方法。
请完成以下内容:
(1)读取文件夹中的图像“pollen.tif.tif”,用imshow(f)和imshow(f,[])显示,并将后一幅图存为”pollen1.tif”。
思考:
为什么图像变清楚了?
>>f=imread('bubbles.tif');
>>imshow(f);
Warning:
Imageistoobigtofitonscreen;displayingat75%scale.
>Intruesize>Resize1at308
Intruesizeat44
Inimshowat161
>>figure,imshow(f,[]);
Warning:
Imageistoobigtofitonscreen;displayingat75%scale.
>Intruesize>Resize1at308
Intruesizeat44
Inimshowat161
(2)用不同的压缩参数(80,50,10)将bubbles.tif保存为jpeg图像,比较压缩参数的作用,并通过imfinfo获取文件信息了解图像的压缩情况对图像质量的影响
>>imwrite(f,'bubbles1.jpg','quality',80);
>>g=imread('bubbles1.jpg');
>>imshow(g);
Warning:
Imageistoobigtofitonscreen;displayingat75%scale.
>Intruesize>Resize1at308
Intruesizeat44
Inimshowat161
>>imwrite(f,'bubbles2.jpg','quality',50);
>>g1=imread('bubbles2.jpg');
>>figure,imshow(g1);
Warning:
Imageistoobigtofitonscreen;displayingat75%scale.
>Intruesize>Resize1at308
Intruesizeat44
Inimshowat161
>>imwrite(f,'bubbles3.jpg','quality',10);
>>g2=imread('bubbles3.jpg');
>>figure,imshow(g2);
Warning:
Imageistoobigtofitonscreen;displayingat75%scale.
>Intruesize>Resize1at308
Intruesizeat44
Inimshowat161
>>imfinfo('bubbles1.jpg')
ans=
Filename:
'bubbles1.jpg'
FileModDate:
'26-Sep-201400:
01:
44'
FileSize:
39129
Format:
'jpg'
FormatVersion:
''
Width:
720
Height:
688
BitDepth:
8
ColorType:
'grayscale'
FormatSignature:
''
NumberOfSamples:
1
CodingMethod:
'Huffman'
CodingProcess:
'Sequential'
Comment:
{}
>>imfinfo('bubbles2.jpg')
ans=
Filename:
'bubbles2.jpg'
FileModDate:
'26-Sep-201400:
02:
46'
FileSize:
20068
Format:
'jpg'
FormatVersion:
''
Width:
720
Height:
688
BitDepth:
8
ColorType:
'grayscale'
FormatSignature:
''
NumberOfSamples:
1
CodingMethod:
'Huffman'
CodingProcess:
'Sequential'
Comment:
{}
>>imfinfo('bubbles3.jpg')
ans=
Filename:
'bubbles3.jpg'
FileModDate:
'26-Sep-201400:
03:
29'
FileSize:
9498
Format:
'jpg'
FormatVersion:
''
Width:
720
Height:
688
BitDepth:
8
ColorType:
'grayscale'
FormatSignature:
''
NumberOfSamples:
1
CodingMethod:
'Huffman'
CodingProcess:
'Sequential'
Comment:
{}
3、自己编写M文件,并将其放在工作目录中,然后在Matlab中使用命令行调用。
X=[1:
0.1:
10];
Y=sin(x);
Plot(x,y);
(了解以上函数的意义,掌握编写和使用m文件的技巧,熟悉基本的GUI编程技术)
>>X=[1:
0.1:
10]
X=
Columns1through9
1.00001.10001.20001.30001.40001.50001.60001.70001.800
Columns10through18
1.90002.00002.10002.20002.30002.40002.50002.60002.7000
Columns19through27
2.80002.90003.00003.10003.20003.30003.40003.50003.6000
Columns28through36
3.70003.80003.90004.00004.10004.20004.30004.40004.5000
Columns37through45
4.60004.70004.80004.90005.00005.10005.20005.30005.4000
Columns46through54
5.50005.60005.70005.80005.90006.00006.10006.20006.3000
Columns55through63
6.40006.50006.60006.70006.80006.90007.00007.10007.2000
Columns64through72
7.30007.40007.50007.60007.70007.80007.90008.00008.1000
Columns73through81
8.20008.30008.40008.50008.60008.70008.80008.90009.0000
Columns82through90
9.10009.20009.30009.40009.50009.60009.70009.80009.9000
Column91
10.0000
>>Y=sin(X)
Y=
Columns1through9
0.84150.89120.93200.96360.98540.99750.99960.99170.9738
Columns10through18
0.94630.90930.86320.80850.74570.67550.59850.51550.4274
Columns19through27
0.33500.23920.14110.0416-0.0584-0.1577-0.2555-0.3508-0.4425
Columns28through36
-0.5298-0.6119-0.6878-0.7568-0.8183-0.8716-0.9162-0.9516-0.9775
Columns37through45
-0.9937-0.9999-0.9962-0.9825-0.9589-0.9258-0.8835-0.8323-0.7728
Columns46through54
-0.7055-0.6313-0.5507-0.4646-0.3739-0.2794-0.1822-0.08310.0168
Columns55through63
0.11650.21510.31150.40480.49410.57840.65700.72900.7937
Columns64through72
0.85040.89870.93800.96790.98820.99850.99890.98940.9699
Columns73through81
0.94070.90220.85460.79850.73440.66300.58490.50100.4121
Columns82through90
0.31910.22290.12450.0248-0.0752-0.1743-0.2718-0.3665-0.4575
Column91
-0.5440
>>plot(X,Y);
4、编写一个M文件,完成以下功能:
输入参数:
文件名
处理:
(1)将图像中每个点的灰度值除于2,
(2)将灰度值为0的点换为灰度值为255,(3)计算图像的最大、最小灰度值和平均值。
输出:
将每次处理的结果显示出来
>>f=imread('bubbles.tif');
>>imshow(f);
Warning:
Imageistoobigtofitonscreen;displayingat75%scale.
>Intruesize>Resize1at308
Intruesizeat44
Inimshowat161
>>g=f/2;
>>figure,imshow(g);
Warning:
Imageistoobigtofitonscreen;displayingat75%scale.
>Intruesize>Resize1at308
Intruesizeat44
Inimshowat161
>>f(f==0)=255;
>>figure,imshow(f);
Warning:
Imageistoobigtofitonscreen;displayingat75%scale.
>Intruesize>Resize1at308
Intruesizeat44
Inimshowat161
>>f=imread('bubbles.tif');
>>min(f(:
))
ans=
17
>>max(f(:
))
ans=
255
>>mean(f(:
))
ans=
137.9148
M文件中
function[f]=Fhanshu(str)
g=imread(str);
imshow(g/2);
g(g==0)=255;
figure,imshow(g);
min(g(:
))
max(g(:
))
mean(g(:
)
>>Fhanshu('bubbles1.jpg');
Warning:
Imageistoobigtofitonscreen;displayingat75%scale.
>Intruesize>Resize1at308
Intruesizeat44
Inimshowat161
InFhanshuat3
Warning:
Imageistoobigtofitonscreen;displayingat75%scale.
>Intruesize>Resize1at308
Intruesizeat44
Inimshowat161
InFhanshuat5
ans=
20
ans=
255
ans=
137.9177
实验2医学图像增强
实验目的:
1.掌握分段线性变换;
2.理解直方图均衡的原理与作用
3.掌握直方图均衡化的Matlab编程
实验内容:
1.研究imadjust函数的使用方法,将图片moon进行明暗反转处理,写出实现函数;
原图显示
>>m=imread('moon.tif');
>>m1=imadjust(m);
>>imshow(m1);
Warning:
Imageistoobigtofitonscreen;displayingat56%scale.
>Intruesize>Resize1at308
Intruesizeat44
Inimshowat161
明暗反转
>>m2=imadjust(m,[01],[10]);
>>figure,imshow(m2);
Warning:
Imageistoobigtofitonscreen;displayingat56%scale.
>Intruesize>Resize1at308
Intruesizeat44
Inimshowat161
将0.5到0.7范围的灰度扩展到整个【01】范围
>>m3=imadjust(m,[0.50.7],[01]);
>>figure,imshow(m3);
Warning:
Imageistoobigtofitonscreen;displayingat56%scale.
>Intruesize>Resize1at308
Intruesizeat44
Inimshowat161
2.利用Matlab图像处理工具箱提供的直方图均衡函数对医学图像“img_LineEnhance.bmp”进行均衡化处理,并显示均衡化前后的直方图。
提示:
下面为直方图均衡化相关的函数说明
x=rgb2gray(I);转换为二维图像,imhist处理的是二维图像
(1)生成并绘制图像的直方图
语法:
h=imhist(f,b)
说明:
b是用于形成直方图的灰度级的个数。
>>a=imread('img_LineEnhance.bmp');
>>a1=rgb2gray(a);
>>imhist(a1);
>>imhist(a1,25);
>>h=imhist(a1,25);
>>horz=linspace(0,255,25);
>>bar(horz,h)
(2)直方图均衡化函数
语法:
g=histeq(f,n)
说明:
n是为输出图像制定的灰度级数。
>>b=histeq(a1,255);
>>imhist(b)
>>b=histeq(a1,55);
>>imhist(b)
>>imshow(a);
>>figure,imshow(a1);
>>figure,imshow(h);
>>figure,imshow(b);
>>figure,imshow(b1);
3.对图片pollen进行线性灰度变换(利用imadjust函数)。
对于输入图片,通过max和min函数求他们的最大最小值,然后将其扩充到[0—255]的灰度空间,看看效果如何,并分析其直方图。
自己编写m文件im2adjust,实现读入一个图片以后自动的将其灰度空间扩充到[0-255]。
>>f=imread('pollen.tif');
>>imshow(f);
>>max(f(:
))
ans=
83
>>min(f(:
))
ans=
13
>>f2=imadjust(f,[13/25583/255],[01]);
>>figure,imshow(f2);
>>imhist(f);
>>imhist(f2);
M文件中
function[f]=im2adjust(str)
g=imread(str);
imshow(g);
min(g(:
))
max(g(:
))
g2=imadjust(g,[min(g(:
))/255max(g(:
))/255],[01]);
figure,imshow(g2);
figure,imhist(g);
figure,imhist(g2);
>>im2adjust('pollen.tif');
ans=
13
ans=
83
实验3医学图像增强
(二)
4.熟悉领域滤波
5.掌握使用Matlab中的函数实现医学图像进行图像锐化的方法;
6.熟悉医学图像离散傅里叶变化的原理和方法;
7.掌握医学图像频域滤波的原理;
8.掌握使用Matlab中的函数实现医学图像进行频域滤波的方法;
1.使用imnoise给图像MRIBrain_10.bmp添加概率为0.2的椒盐噪声,然后分别使用fspecial产生3*3、5*5、7*7的方形模板,并使用imfilter对有噪声的图像进行空间滤波,观察滤波效果并说明原因。
再给图像MRIBrain_10.bmp添加均值为0,方差为0.01的高斯噪声,使用三种模板对其进行滤波,观察其效果并说明在两种噪声中使用模板进行滤波产生的差别及原因。
对于椒盐噪声,中值滤波效果比均值滤波效果好。
原因:
椒盐噪声是幅值近似相等但随机分布在不同位置上,图像中有干净点也有污染点。
中值滤波是选择适当的点来替代污染点的值,所以处理效果好。
因为噪声的均值不为0,所以均值