比较线性模型和Probit模型、Logit模型.doc
《比较线性模型和Probit模型、Logit模型.doc》由会员分享,可在线阅读,更多相关《比较线性模型和Probit模型、Logit模型.doc(5页珍藏版)》请在冰豆网上搜索。
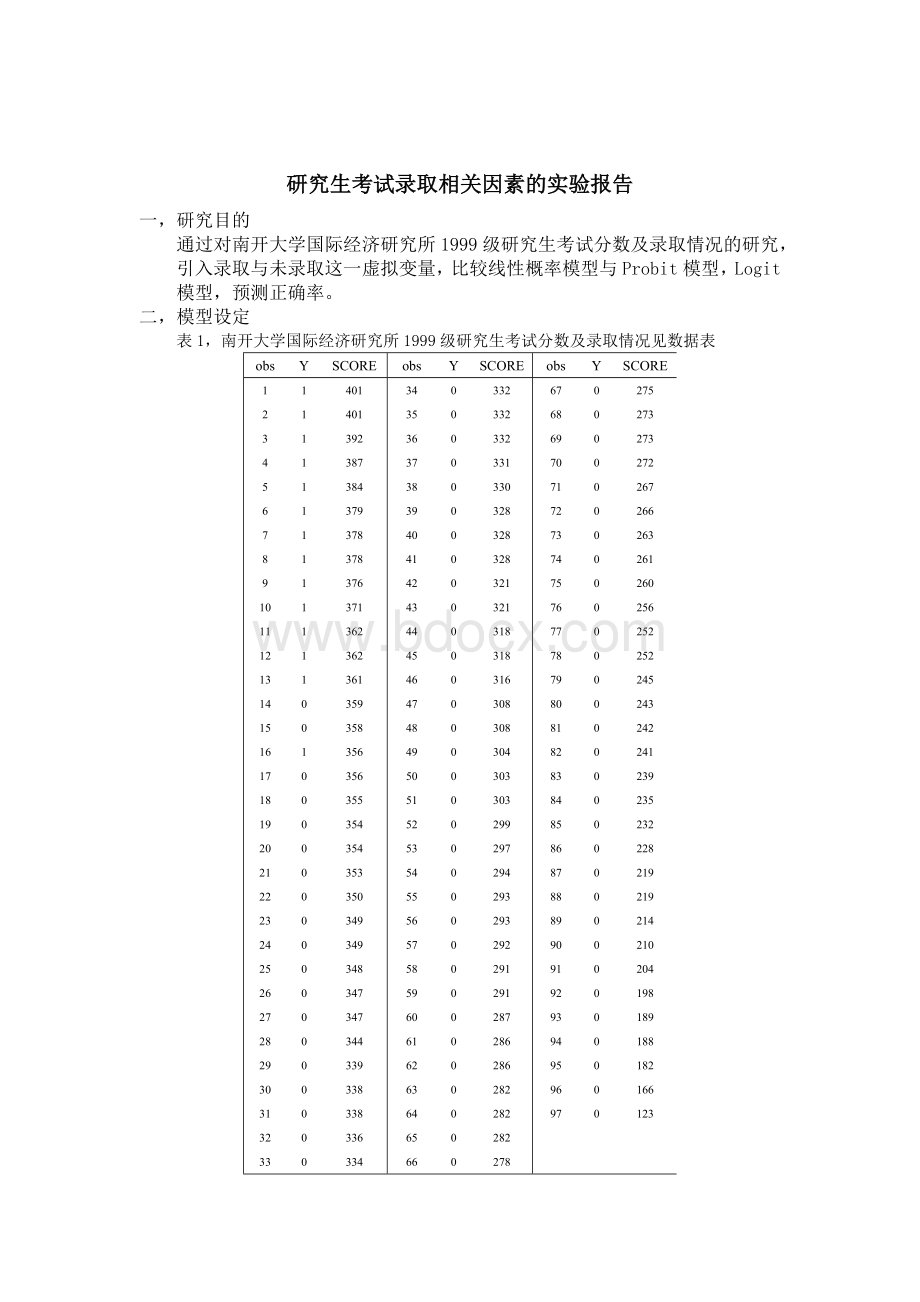
研究生考试录取相关因素的实验报告
一,研究目的
通过对南开大学国际经济研究所1999级研究生考试分数及录取情况的研究,引入录取与未录取这一虚拟变量,比较线性概率模型与Probit模型,Logit模型,预测正确率。
二,模型设定
表1,南开大学国际经济研究所1999级研究生考试分数及录取情况见数据表
obs
Y
SCORE
obs
Y
SCORE
obs
Y
SCORE
1
1
401
34
0
332
67
0
275
2
1
401
35
0
332
68
0
273
3
1
392
36
0
332
69
0
273
4
1
387
37
0
331
70
0
272
5
1
384
38
0
330
71
0
267
6
1
379
39
0
328
72
0
266
7
1
378
40
0
328
73
0
263
8
1
378
41
0
328
74
0
261
9
1
376
42
0
321
75
0
260
10
1
371
43
0
321
76
0
256
11
1
362
44
0
318
77
0
252
12
1
362
45
0
318
78
0
252
13
1
361
46
0
316
79
0
245
14
0
359
47
0
308
80
0
243
15
0
358
48
0
308
81
0
242
16
1
356
49
0
304
82
0
241
17
0
356
50
0
303
83
0
239
18
0
355
51
0
303
84
0
235
19
0
354
52
0
299
85
0
232
20
0
354
53
0
297
86
0
228
21
0
353
54
0
294
87
0
219
22
0
350
55
0
293
88
0
219
23
0
349
56
0
293
89
0
214
24
0
349
57
0
292
90
0
210
25
0
348
58
0
291
91
0
204
26
0
347
59
0
291
92
0
198
27
0
347
60
0
287
93
0
189
28
0
344
61
0
286
94
0
188
29
0
339
62
0
286
95
0
182
30
0
338
63
0
282
96
0
166
31
0
338
64
0
282
97
0
123
32
0
336
65
0
282
33
0
334
66
0
278
定义变量SCORE:
考生考试分数;Y:
考生录取为1,未录取为0。
上图为样本观测值。
1.线性概率模型
根据上面资料建立模型
用Eviews得到回归结果如图:
DependentVariable:
Y
Method:
LeastSquares
Date:
12/10/10Time:
20:
38
Sample:
197
Includedobservations:
97
Variable
Coefficient
Std.Error
t-Statistic
Prob.
C
-0.847407
0.159663
-5.307476
0.0000
SCORE
0.003297
0.000521
6.325970
0.0000
R-squared
0.296390
Meandependentvar
0.144330
AdjustedR-squared
0.288983
S.D.dependentvar
0.353250
S.E.ofregression
0.297866
Akaikeinfocriterion
0.436060
Sumsquaredresid
8.428818
Schwarzcriterion
0.489147
Loglikelihood
-19.14890
F-statistic
40.01790
Durbin-Watsonstat
0.359992
Prob(F-statistic)
0.000000
参数估计结果为:
-0.847407+0.003297
Se=(0.159663)(0.000521)
t=(-5.307476)(6.325970)
p=(0.0000)(0.0000)
预测正确率:
Forecast:
YF
Actual:
Y
Forecastsample:
197
Includedobservations:
97
RootMeanSquaredError
0.294780
MeanAbsoluteError
0.233437
MeanAbsolutePercentageError
8.689503
TheilInequalityCoefficient
0.475786
BiasProportion
0.000000
VarianceProportion
0.294987
CovarianceProportion
0.705013
2.Logit模型
DependentVariable:
Y
Method:
ML-BinaryLogit(Quadratichillclimbing)
Date:
12/10/10Time:
21:
38
Sample:
197
Includedobservations:
97
Convergenceachievedafter11iterations
Covariancematrixcomputedusingsecondderivatives
Variable
Coefficient
Std.Error
z-Statistic
Prob.
C
-243.7362
125.5564
-1.941248
0.0522
SCORE
0.679441
0.350492
1.938536
0.0526
Meandependentvar
0.144330
S.D.dependentvar
0.353250
S.E.ofregression
0.115440
Akaikeinfocriterion
0.123553
Sumsquaredresid
1.266017
Schwarzcriterion
0.176640
Loglikelihood
-3.992330
Hannan-Quinncriter.
0.145019
Restr.loglikelihood
-40.03639
Avg.loglikelihood
-0.041158
LRstatistic(1df)
72.08812
McFaddenR-squared
0.900282
Probability(LRstat)
0.000000
ObswithDep=0
83
Totalobs
97
ObswithDep=1
14
得Logit模型估计结果如下
pi=F(yi)=拐点坐标(358.7,0.5)
其中Y=-243.7362+0.6794X
预测正确率
Forecast:
YF
Actual:
Y
Forecastsample:
197
Includedobservations:
97
RootMeanSquaredError
0.114244
MeanAbsoluteError
0.025502
MeanAbsolutePercentageError
1.275122
TheilInequalityCoefficient
0.153748
BiasProportion
0.000000
VarianceProportion
0.025338
CovarianceProportion
0.974662
3.Probit模型
DependentVariable:
Y
Method:
ML-BinaryProbit(Quadratichillclimbing)
Date:
12/10/10Time:
21:
40
Sample:
197
Includedobservations:
97
Convergenceachievedafter11iterations
Covariancematrixcomputedusingsecondderivatives
Variable
Coefficient
Std.Error
z-Statistic
Prob.
C
-144.4560
70.19809
-2.057833
0.0396
SCORE
0.402868
0.196186
2.053504
0.0400
Meandependentvar
0.144330
S.D.dependentvar
0.353250
S.E.ofregression
0.116277
Akaikeinfocriterion
0.122406
Sumsquaredresid
1.284441
Schwarzcriterion
0.175493
Loglikelihood
-3.936702
Hannan-Quinncriter.
0.143872
Restr.loglikelihood
-40.03639
Avg.lo
 升级会员
升级会员 