matlab实用程序一百例Word文档下载推荐.docx
《matlab实用程序一百例Word文档下载推荐.docx》由会员分享,可在线阅读,更多相关《matlab实用程序一百例Word文档下载推荐.docx(63页珍藏版)》请在冰豆网上搜索。
plot(x,y,'
-*r'
linewidth'
1);
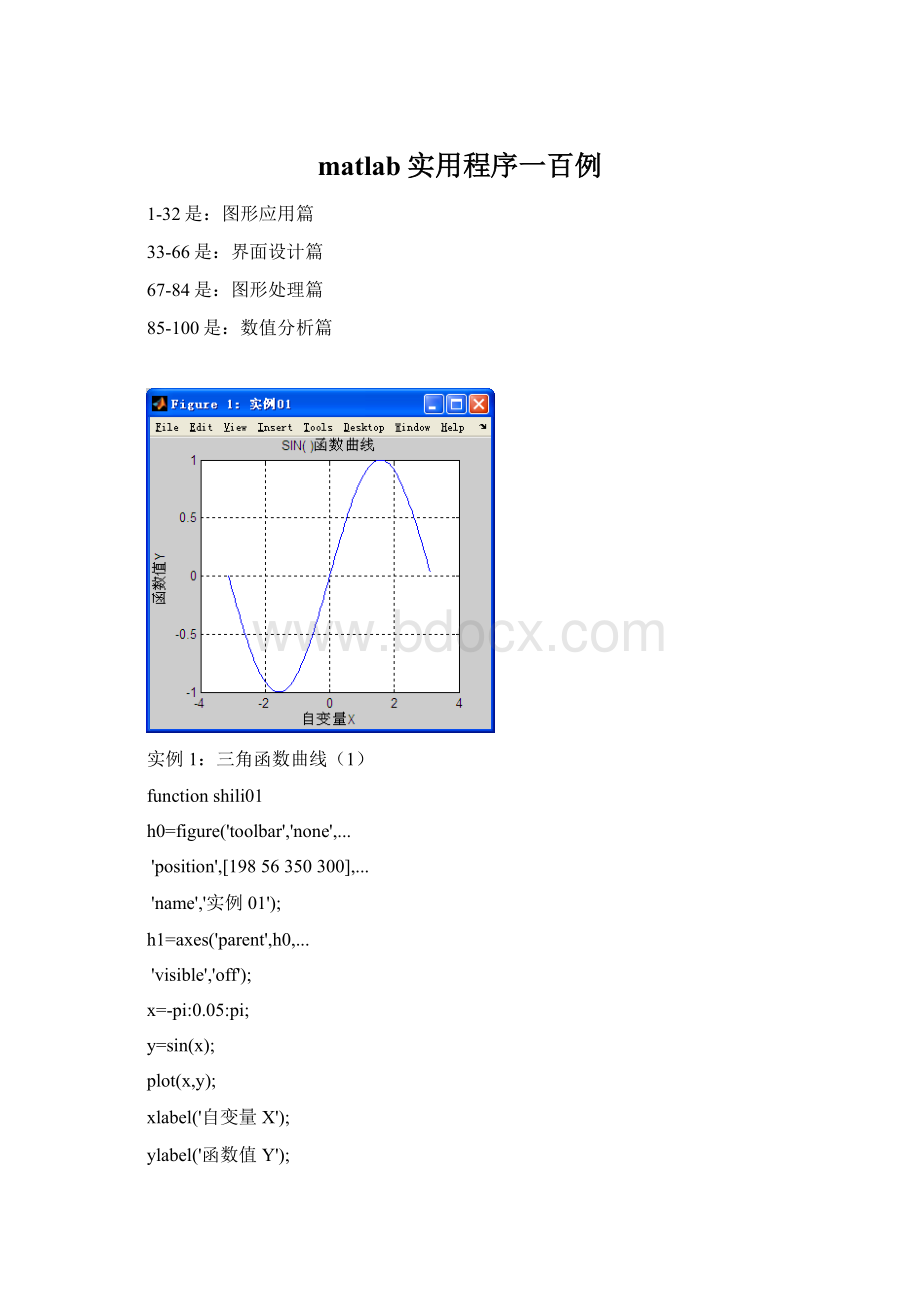
三角函数'
实例3:
图形的叠加
functionshili03
实例03'
y1=sin(x);
y2=cos(x);
plot(x,y1,...
x,y2,...
--og'
实例4:
双y轴图形的绘制
functionshili04
[200150450250],...
实例04'
x=0:
900;
a=1000;
b=0.005;
y1=2*x;
y2=cos(b*x);
[haxes,hline1,hline2]=plotyy(x,y1,x,y2,'
semilogy'
plot'
axes(haxes
(1))
semilogplot'
axes(haxes
(2))
linearplot'
实例5:
单个轴窗口显示多个图形
functionshili05
实例05'
t=0:
pi/10:
2*pi;
[x,y]=meshgrid(t);
subplot(2,2,1)
plot(sin(t),cos(t))
axisequal
subplot(2,2,2)
z=sin(x)-cos(y);
plot(t,z)
axis([02*pi-22])
subplot(2,2,3)
h=sin(x)+cos(y);
plot(t,h)
subplot(2,2,4)
g=(sin(x).^2)-(cos(y).^2);
plot(t,g)
axis([02*pi-11])
实例6:
图形标注
functionshili06
[200150450400],...
实例06'
h=plot(t,sin(t));
t=0到2\pi'
fontsize'
16);
sin(t)'
\it{从0to2\pi的正弦曲线}'
16)
x=get(h,'
xdata'
y=get(h,'
ydata'
imin=find(min(y)==y);
imax=find(max(y)==y);
text(x(imin),y(imin),...
['
\leftarrow最小值='
num2str(y(imin))],...
text(x(imax),y(imax),...
\leftarrow最大值='
num2str(y(imax))],...
实例7:
条形图形
functionshili07
[200150450350],...
实例07'
tiao1=[56254822454541445745512];
tiao2=[4748575854526548];
7;
bar(t,tiao1)
X轴'
TIAO1值'
h1=gca;
h2=axes('
get(h1,'
));
plot(t,tiao2,'
3)
set(h2,'
yaxislocation'
right'
color'
xticklabel'
[])
实例8:
区域图形
functionshili08
[200150450250],...
实例08'
x=91:
95;
profits1=[8875849377];
profits2=[5164545668];
profits3=[4254342524];
profits4=[263818154];
area(x,profits1,'
facecolor'
[0.50.90.6],...
edgecolor'
b'
holdon
area(x,profits2,'
[0.90.850.7],...
y'
area(x,profits3,'
[0.30.60.7],...
r'
area(x,profits4,'
[0.60.50.9],...
m'
holdoff
set(gca,'
xtick'
[91:
95])
layer'
top'
)
gtext('
\leftarrow第一季度销量'
\leftarrow第二季度销量'
\leftarrow第三季度销量'
\leftarrow第四季度销量'
年'
销售量'
实例9:
饼图的绘制
functionshili09
实例09'
t=[542135;
685435;
452512;
486845;
685469];
x=sum(t);
h=pie(x);
textobjs=findobj(h,'
type'
text'
str1=get(textobjs,{'
string'
});
val1=get(textobjs,{'
extent'
oldext=cat(1,val1{:
names={'
商品一:
'
;
商品二:
商品三:
};
str2=strcat(names,str1);
set(textobjs,{'
},str2)
val2=get(textobjs,{'
newext=cat(1,val2{:
offset=sign(oldext(:
1)).*(newext(:
3)-oldext(:
3))/2;
pos=get(textobjs,{'
textpos=cat(1,pos{:
textpos(:
1)=textpos(:
1)+offset;
},num2cell(textpos,[3,2]))
实例10:
阶梯图
functionshili10
[200150450400],...
实例10'
a=0.01;
b=0.5;
10;
f=exp(-a*t).*sin(b*t);
stairs(t,f)
plot(t,f,'
:
*'
glabel='
函数e^{-(\alpha*t)}sin\beta*t的阶梯图'
gtext(glabel,'
10'
axis([010-1.21.2])
实例11:
枝干图
functionshili11
实例11'
pi/20:
h1=stem(x,y1+y2);
h2=plot(x,y1,'
^r'
x,y2,'
*g'
h3=[h1
(1);
h2];
legend(h3,'
y1+y2'
y1=sin(x)'
y2=cos(x)'
正弦函数与余弦函数的线性组合'
实例12:
罗盘图
functionshili12
实例12'
winddirection=[54246584
2561223562
12532434254];
windpower=[2553
68127
614108];
rdirection=winddirection*pi/180;
[x,y]=pol2cart(rdirection,windpower);
compass(x,y);
desc={'
风向和风力'
北京气象台'
10月1日0:
00到'
10月1日12:
00'
gtext(desc)
实例13:
轮廓图
functionshili13
实例13'
[th,r]=meshgrid((0:
10:
360)*pi/180,0:
1);
[x,y]=pol2cart(th,r);
z=x+i*y;
f=(z.^4-1).^(0.25);
contour(x,y,abs(f),20)
实部'
虚部'
h=polar([02*pi],[01]);
delete(h)
实例14:
交互式图形
functionshili14
实例14'
axis([010010]);
x=[];
y=[];
n=0;
disp('
单击鼠标左键点取需要的点'
单击鼠标右键点取最后一个点'
but=1;
whilebut==1
[xi,yi,but]=ginput
(1);
plot(xi,yi,'
bo'
n=n+1;
disp('
单击鼠标左键点取下一个点'
x(n,1)=xi;
y(n,1)=yi;
end
t=1:
n;
ts=1:
0.1:
xs=spline(t,x,ts);
ys=spline(t,y,ts);
plot(xs,ys,'
r-'
实例15:
变换的傅立叶函数曲线
functionshili15
实例15'
m=moviein(20,gcf);
nextplot'
replacechildren'
h=uicontrol('
style'
slider'
[1001050020],'
min'
1,'
max'
20)
forj=1:
20
plot(fft(eye(j+16)))
set(h,'
value'
j)
m(:
j)=getframe(gcf);
clf;
axes('
[0011]);
movie(m,30)
实例16:
劳伦兹非线形方程的无序活动
functionshili16
20)
实例17:
填充图
functionshili17
实例17'
t=(1:
2:
15)*pi/8;
x=sin(t);
y=cos(t);
fill(x,y,'
axissquareoff
text(0,0,'
STOP'
[111],...
50,...
horizontalalignment'
center'
例18:
条形图和阶梯形图
functionshili18
实例18'
x=-3:
0.2:
3;
y=exp(-x.*x);
bar(x,y)
2-DBarChart'
bar3(x,y,'
3-DBarChart'
)
stairs(x,y)
StairChart'
barh(x,y)
HorizontalBarChart'
实例19:
三维曲线图
functionshili19
实例19'
subplot(2,1,1)
x=linspace(0,2*pi);
y3=sin(x)+cos(x);
z1=zeros(size(x));
z2=0.5*z1;
z3=z1;
plot3(x,y1,z1,x,y2,z2,x,y3,z3)
Y轴'
zlabel('
Z轴'
Figure1:
3-DPlot'
subplot(2,1,2)
plot3(x,z1,y1,x,z2,y2,x,z3,y3)
Figure2:
实例20:
图形的隐藏属性
functionshili20
[200150450300],...
实例20'
subplot(1,2,1)
[x,y,z]=sphere(10);
mesh(x,y,z)
axisoff
Opaque'
hiddenon
subplot(1,2,2)
Transparent'
hiddenoff
实例21PEAKS函数曲线
functionshili21
[200100450450],...
实例21'
[x,y,z]=peaks(30);
x=x(1,:
y=y(:
i=find(y>
0.8&
y<
1.2);
j=find(x>
-0.6&
x<
0.5);
z(i,j)=nan*z(i,j);
surfc(x,y,z)
surfc函数形成的曲面'
surfl(x,y,z)
surfl函数形成的曲面'
实例22:
片状图
functionshili22
[200150550350],...
实例22'
x=rand(1,20);
y=rand(1,20);
z=peaks(x,y*pi);
t=delaunay(x,y);
trimesh(t,x,y,z)
TriangularSurfacePlot'
trisurf(t,x,y,z)
实例23:
视角的调整
functionshili23
实例23'
x=-5:
0.5:
5;
[x,y]=meshgrid(x);
r=sqrt(x.^2+y.^2)+eps;
z=sin(r)./r;
surf(x,y,z)
X-axis'
 升级会员
升级会员 