Digital communication practical session assignment 1Word下载.docx
《Digital communication practical session assignment 1Word下载.docx》由会员分享,可在线阅读,更多相关《Digital communication practical session assignment 1Word下载.docx(9页珍藏版)》请在冰豆网上搜索。
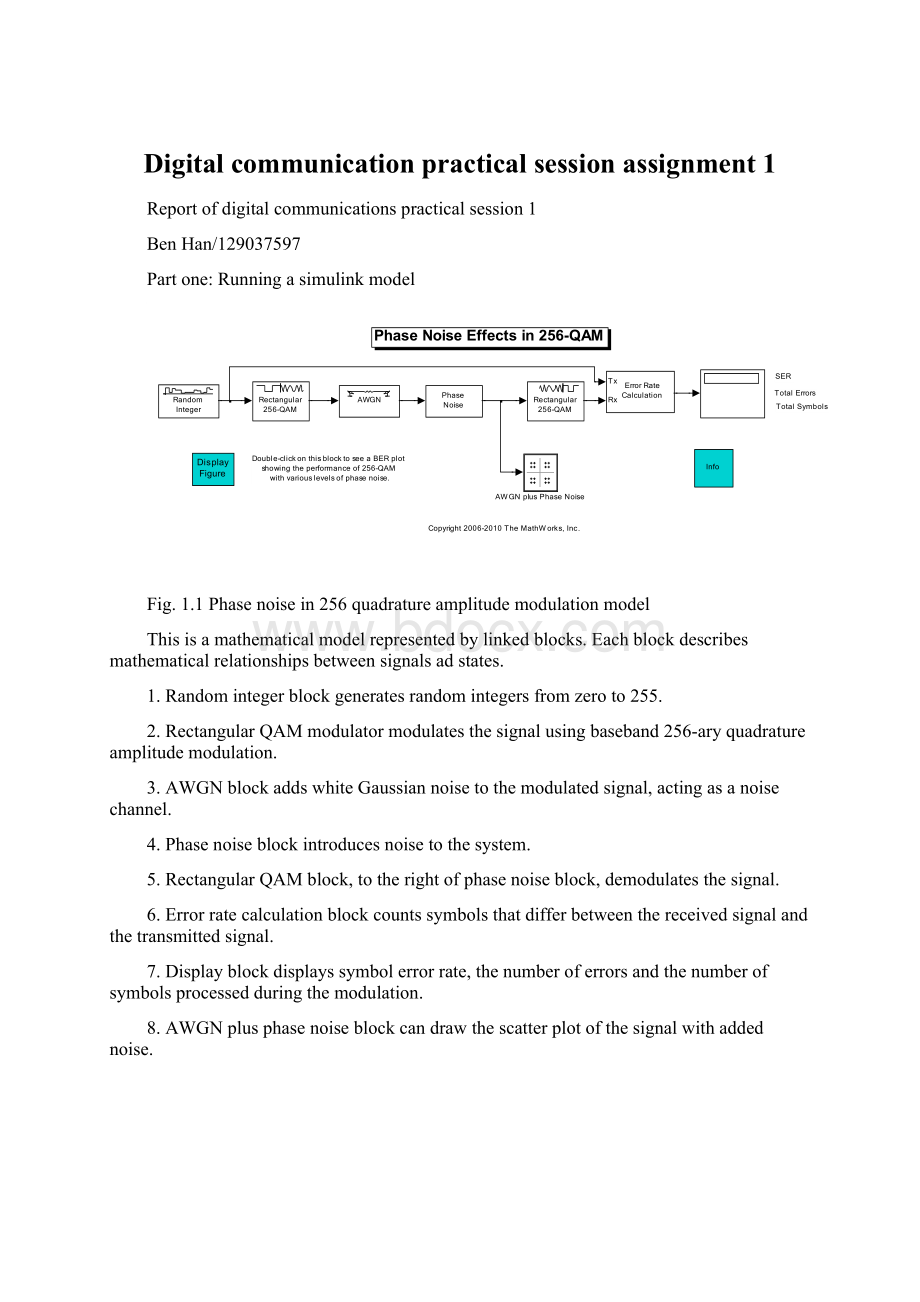
Thisisamathematicalmodelrepresentedbylinkedblocks.Eachblockdescribesmathematicalrelationshipsbetweensignalsadstates.
1.Randomintegerblockgeneratesrandomintegersfromzeroto255.
2.RectangularQAMmodulatormodulatesthesignalusingbaseband256-aryquadratureamplitudemodulation.
3.AWGNblockaddswhiteGaussiannoisetothemodulatedsignal,actingasanoisechannel.
4.Phasenoiseblockintroducesnoisetothesystem.
5.RectangularQAMblock,totherightofphasenoiseblock,demodulatesthesignal.
6.Errorratecalculationblockcountssymbolsthatdifferbetweenthereceivedsignalandthetransmittedsignal.
7.Displayblockdisplayssymbolerrorrate,thenumberoferrorsandthenumberofsymbolsprocessedduringthemodulation.
8.AWGNplusphasenoiseblockcandrawthescatterplotofthesignalwithaddednoise.
Fig.1.2Thescstterplotofasignalplusnoise
Figure1.2showsthescatterplotofthemodulatedsignalwithnoise.Thepointslieinaradialpattern.
Fig.1.3Resultofsimulation
Figure1.3showsthesignalerrorrateis0.007524,thenumberoftotalerrorsis79andthenumberoftotalsymbolsis10500.
Fig.1.4ThemaskofPhaseNoiseBlock
Fig.1.5Anewscatterplot(constellationdiagram)
Bysettingphasenoiselevelto-150dBc/HzinphasenoiseblockandEs/No(signaltonoiseratio)to100inAWGNblockIobtainsthefigure1.5.Phasenoiserepresentsthenoisepowerrelativetothecarriercontainedina1Hzbandwidthcentredatacertainoffsetsfromthecarrier.Itisquantifiedintheunitofmeasure
called“scriptLofF”,whichisequalto
Whilesignaltonoiseratioisthevalueofsignalpowerdividedbynoisepower.Bysettingthesetwovaluesto-150and100respectively,thenoiseinthesystemisalmostclearedthusthescatterplotlooksliketheconstellationfor256-aryQAM.(Notgoingabove0ofphasenoiselevel)
Fig.1.6Scatterplot(phasenoiselevel-10dBc/Hz)
Whenchangingthephasenoiselevelfrom-150dBc/Hzto-10dBc/Hz,phasenoisehasbeenincreased,thusthepointsdonotlieexactlyontheconstellationanymore.
Fig.1.7PlotofBERatdifferentnoiselevels
Thehorizontalaxisisthesignaltonoiseratio,andtheverticalaxisisbiterrorratio.Differentcurvecorrespondstodifferentphasenoiselevel.
Parttwo:
Bulidingasimplemodel
Fig.2.1Asimplesimulinkmodel
Usingcommandcommstartupbeforesettingupnewmodel,thenselectblocksfromthesimulinklibraryanddragtheseblockstonewmodelwindowtobuildupnewmodel.Finallyconnecttheblocksusingarrowheadlines.
Thensettheparametersofthesinewaveblock.Theamplitudeis5,thefrequencyis30Hzandthesampleperfameis100.Thedefaultvalueofstoptimeinthemodelconfigurationparametersdialogboxisinfinite,inordertocapturetheimageofthesinewave,thevalueshouldbeassignedasafinitenumber.Figure2.2issinewaveobservedfromthevectorscope.Sinethereisnonoiseinthemodel,thewaveformispurelysinusoidal.
Fig.2.2Thesinewaveobservedfromthescope
Fig2.3Asinewavemodelplusnoise
TheAWGNblock,whichstandsforaddictivewhiteGaussiannoise,modifiesthechannelnoiseinthemodel.Whitenoisecontainsequalpowerwithinafixedbandwidthatanycentrefrequency.GaussiannoiseindicatesthatthevaluesofthenoisecantakeonareGaussian-distributed.WhiteGaussiannoisemeansthevaluesatanypairoftimesareidenticallydistributedandstatisticallyindependent.Figure2.3showsthemodelwithchannelnoiseandfigure2.4showsthesimulationresultwithnoise.Becaeseoftheaddednoise,thesinussoidalsignalgeneratedbythesinewavegeneratorisdisturbedandthereforeoutputsignalhassomefluctuationonthebasisofthepuresinusoidalwaveform.
Fig.2.4Sinewavewithaddednoise
Partthree:
Buildingachannelnoisemodel
Fig.3.1Channelnoisemodel
Figure3.1isachannelnoisemodel.Thebernoullibinarygeneratorblockgeneratesabinarysignalasasource,thebinarysymmetricchannelblockdisturbsthesignalbychanginga0toa1ortheviceverse,theerrorratecalculationblockcalculatestheerrorratebycomparingthetwosignalsfromTxportandRxportandfinallytheresultisshowninthedisplayblock.
Beforerunningthemodel,changetheerrorprobabilityto0.01andcleartheoutputerrorcheckboxofthebinarysymmetricchannel’smask,setoutputdatatoportoftheerrorratecalculationblock’smask.
Fig.3.2Theresultofchannelnoisemodelsimulation
Figure3.2showstheresultofthissimulation.biterrorrateis0.01147,thenumberoferrorsis100andnumberoftransmittedbitsis8717.Theerrornumbercanbechangedintheerrorratecalculationblock.Thebiterrorrateisthenumberofbiterrorsdividedbytotalnumberoftransferredbits.
Partfour:
Reducingtheerrorrateusingahammingcode
Fig.4.1Hammingcodemodel
Inordertoreducethebiterrorrate,ahammingencoderanddecoderblockareaddedbeforeandafterthebinarysymmetricchannelblock.Thedefaulthammingcodeis[7,4]codewhichmeansthe4-bitinputdatacanbeencodedinto7-bitoutputdatabyaddingthreebitsattheendofeachcode.Thusthecodepatternexpandsfrom
to
.Thereforeeachoutputdatacanbeseentodifferfromotherdatabyatleastthreebits.Whenthedecoderreceivesthemessage,iftherulediscussedaboveisnotsatisfied,itcanrealizethatthedataisnotcorrect.Itcaneithercorrectthefaultmessageorjustignoreit.
Beforerunningthehammingcodemodel,Iselecttheframe-basedoutputsboxandsetsampleperframeto4inthemaskofbinarygeneratorblock.Becausehammingencoderblockrequirestheinputtobeavectorofaspecificsize,inthiscase,thesizeis4.Theerroris0.001044accordingtofigure4.1.
Theframesizecanbedisplayedintheblockbyselectingsignaldimensionsfromtheport/signaldisplaysubmenuoftheformatmenu.[4*1]indicatesthattheblockgeneratescolumnvectorofsize4.
Fig.4.3Anexpandedmodelwithascopetoseethechannelerrors
Fig.4.4Channelerrorsobservation
Byaddingascopeblockinthemodel,thechannelnoiseproducedbythebinarysymmetricchannelcanbeseen.Beforerunningthemodel,thestopsimulationboxshouldbeclearedintheerrorratecalculationblock’smask.Theupperscopeshowsthechannelerrorsgeneratedbythebinarysymmetricchannel.Thelowerscopeshowstheuncorrectederrors.
Fig.4.5Zoominginonthescope
Thenarrowrectangularpulserepresentsonetimeinterval,whichis1secondinthisscope.Thewiderrectangularpulseintheupperscopehasacorrespondingnarrowrectangularpulseinthelowerscope,whichmeansthewideronehasnotbeencorrectedbythehammingencodeblock.Whilethenarrowonetotherightofthewideroneintheupperscoperepresentsacorrectedsingleerror.
Partfive:
Modelingachannelwithmodulation
Fig.5.1Channelmodellingwithdigitalmodulation
Themodelinfigure5.1usestheBPSKmodulatorbaseband,AWGNchannelandtheBPSKdemodulatorbasebandblockstoSimulinkachannelwithnoise.Phaseshiftkeyingisadigitalmodulationschemethattransmitsdatabymodulatingthecarrierwave.Theinformationiscontainedintheinstantaneousphaseofthemodulatedcarrierwaveandthephaseisusuallyimposedandmeasuredwithrespecttoafixedknowncarriercalledcoherentcarrier.BinaryPSKusestwophaseswhichareseparatedby180degree.ThusitisthemoststablemodulationofallthePSKs.
 升级会员
升级会员 